Maps and Data - Average Annual Fuel Use by Vehicle Type
Find maps and charts showing transportation data and trends related to alternative fuels and vehicles.
OR
Sort by:
119 results
-
Vehicles: AFVs and HEVs
-
-
Biodiesel Purchases by EPAct-Regulated Fleets
Trend of State and Alternative Fuel Provider Biodiesel Purchases from 2000 to 2022 Last update June 2023
-
-
-
Clean Cities and Communities Alternative Fuel Vehicle Inventory
Alternative fuel vehicle inventory reported by Clean Cities and Communities coalitions from 2004 to 2022 Last update February 2024
-
-
-
Clean Cities and Communities Energy Use Impact by AFV Type
Trend of energy impact by fuels used in alternative fuel vehicles (AFVs) from 2004 to 2022 Last update February 2024
-
-
-
Efficiency Ratios for Light-Duty All-Electric Vehicles in the United States
Provides efficiency ratios of on-road all-electric vehicles in the United States in 2021, based on vehicle registration data. Last update June 2023
-
-
-
EPAct State & Alternative Fuel Provider Fleet Exemptions
Trend of State & Alternative Fuel Provider (S&FP) exemption requests and vehicles exempted from 1997 to 2022 Last update June 2023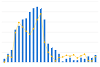
-
-
-
Light-Duty AFV, HEV, and Diesel Model Offerings, by Technology/Fuel
Trend of vehicle models incorporating various advanced technologies or alternative fuels, from 1991 through 2022 Last update January 2023
-
-
-
Light-Duty AFV Registrations
Breakdown of alternative fuel vehicle (AFV) registrations by fuel type Last update August 2022
-
-
-
TransAtlas
Interactive map displays light-duty vehicle registration counts over time by state and fuel type
-
-
-
Transit Buses by Fuel Type
Trend of buses powered by various fuels in the United States, 2007-2021 Last update April 2024
-
-
-
Types of Vehicles by Weight Class
Chart shows typical vehicle types within the Federal Highway Administration (FHWA) vehicle classes Last update June 2012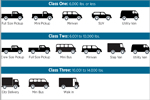
-
-
-
U.S. HEV Sales by Model
Trend of sales by hybrid electric vehicle (HEV) model, 1999-2019 Last update January 2020
-
-
-
U.S. Plug-in Electric Vehicle Sales by Model
Trend of sales by PEV model, 2011-2019 Last update January 2020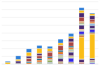
-
-
-
Vehicle Credits Traded by Regulated Fleets
Trend of State & Alternative Fuel Provider (S&FP) EPAct credits traded and transactions from 1997 to 2022 Last update June 2023
-
-
-
Vehicle Weight Classes & Categories
Charts illustrate the vehicle weight classes and categories used by the Federal Highway Administration (FHWA), the U.S. Census Bureau, and the U.S. Environmental Protection Agency (EPA). Last update June 2012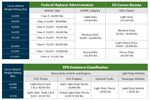
-
-
Vehicles: Fuel Consumption and Efficiency
-
-
Average Annual Fuel Use by Vehicle Type
Comparison of fuel use (per vehicle) among vehicle types Last update February 2024
-
-
-
Average Annual Vehicle Miles Traveled by Major Vehicle Category
Comparison of miles traveled (per vehicle) among vehicle types Last update January 2024
-
-
-
Average Fuel Consumption at Increasing Road Grades
Trend of fuel consumption at increasing road grades, for various vehicle types Last update August 2014
-
-
-
Average Fuel Economy by Major Vehicle Category
Comparison of fuel economy among vehicle types Last update January 2024
-
-
-
Average Per-Passenger Fuel Economy by Travel Mode
Comparison of per-passenger fuel economy for various modes of transportation Last update October 2022
-
-
-
Clean Cities and Communities Energy Use Impact by VMT Reduction and FE
Trend of energy impact by fuel economy (FE) improvements and reductions in vehicle miles traveled (VMT) from 2004 to 2022 Last update February 2024
-
-
-
Clean Cities and Communities Energy Use Impact through Idle Reduction
Trend of energy impact by idle reduction policies and technologies from 2004 to 2022 Last update February 2024
-
-
-
Composition of New U.S. Light-Duty Vehicles by Vehicle Type
Trend showing the shift in popularity of trucks versus cars by year Last update January 2024
-
-
-
Efficiency Ratios for Light-Duty All-Electric Vehicles in the United States
Provides efficiency ratios of on-road all-electric vehicles in the United States in 2021, based on vehicle registration data. Last update June 2023
-
-
-
Energy Expenditures by Sector
Trend of U.S. transportation and residential energy expenditures, per capita, from 1970 to 2021 Last update January 2024
-
-
-
Energy Losses in Light-Duty Gasoline Vehicles
Breakdown of energy lost to various factors in light-duty vehicles Last update January 2024
-

Average Annual Fuel Use by Vehicle Type
| Transit Bus | Class 8 Truck | Refuse Truck | Demand Response | Delivery Truck | School Bus | Light Truck/Van | Car | Motorcycle | |
| Annual Fuel Use (GGE) | 9605.263157894737 | 10745.47151548672 | 10089 | 4157 | 1765.170670037927 | 2122.567577343204 | 635.8426966292135 | 433.3196721311476 | 45.56818181818182 |
Source:
This chart shows average annual fuel use (per vehicle) for major vehicle categories in the United States. The metric used is gasoline gallon equivalents (GGEs), representing a quantity of fuel with the same amount of energy contained in a gallon of gasoline. The two factors affecting the average annual fuel use of a vehicle are the average miles traveled per year (correlative) and the fuel economy of the vehicle (inversely correlative). Transit buses, which are relatively inefficient because of their stop-and-go drive cycles and heavy loads, consume more fuel on average than any other vehicle type. Class 8 trucks, which typically travel long distances carrying heavy loads, use the second-largest amount of fuel. Refuse trucks, like transit buses, are inefficient because of their heavy loads and stop-and-go drive cycles. The last three vehicle types are owned by individual consumers, and they each use a fraction of the fuel consumed by fleet-based vehicles, on a per-vehicle basis. See also Average Annual Vehicle Miles Traveled by Major Vehicle Category and Average Fuel Economy by Major Vehicle Category.
- Federal Highway Administration Highway Statistics 2021, Table VM-1.
- World Resources Institute Electric School Bus Initiative, Recommended total cost of ownership parameters for electric school buses, Table 1Highway Statistics 2021, Table VM-1.
- Gordon, Deborah, Juliet Burdelski, and James S. Cannon. Greening Garbage Trucks: New Technologies for Cleaner Air. Inform, Inc. 2003.
- Calculated from statistics found in American Public Transit Association's 2022 Public Transportation Fact Book.
- To see additional references, download the Excel spreadsheet.
To view more details, notes, and acronyms, please download the Excel spreadsheet.
Print