Maps and Data - Change in U.S. Light-Duty Vehicle Registration Counts
Find maps and charts showing transportation data and trends related to alternative fuels and vehicles.
OR
Sort by:
119 results
-
Fuels & Infrastructure: Fuel Trends
-
-
Average Annual Retail Fuel Price of Gasoline
Trend of gasoline prices, actual and inflation-adjusted, from 1950 to 2023 Last update January 2024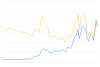
-
-
-
Average Renewable Diesel and Diesel Fuel Prices in California
Trend of renewable diesel and diesel motor fuel prices in California from 2017 to 2024 Last update December 2024
-
-
-
Average Retail Fuel Prices in the United States
Trend of alternative and traditional motor fuel prices from 2000 to 2024 Last update December 2024
-
-
-
Change in U.S. Light-Duty Vehicle Registration Counts
Trend of light-duty vehicle registrations by fuel type, measured in percent change from 2016 through 2023 Last update June 2024
-
-
-
Consumption of Natural Gas in the United States
U.S. natural gas consumption by end use in 2022 Last update January 2024
-
-
-
Energy Use by Transportation Mode and Fuel Type
Amount of energy consumed through different transportation modes, 2019 Last update May 2023
-
-
-
Fuel Taxes by Country
Comparison of gasoline and diesel taxes in Organization for Economic Cooperation and Development countries Last update March 2019
-
-
-
Fuel Use by Transportation Mode in 2019
Breakdown of fuel used in the United States by transportation mode, 2019 Last update May 2023
-
-
-
Global Ethanol Production by Country or Region
Quantity of ethanol produced by country/region from 2007 to 2022 Last update January 2024
-
-
-
Renewable Diesel Production and Consumption
Renewable diesel domestic production and consumption from 2013 to 2023 Last update October 2024
-
-
-
Sustainable Aviation Fuel Estimated Consumption
Estimated U.S. consumption of sustainable aviation fuel from 2016 to 2023 Last update September 2023
-
-
-
U.S. Biodiesel Production, Exports, and Consumption
Trend of biodiesel production, exports, and consumption from 2001 to 2023 Last update April 2024
-
-
-
U.S. Crude Oil Imports by Country of Origin
Quantity of oil imports by country of production, from 1973 to 2023 Last update December 2023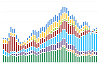
-
-
-
U.S. Production, Consumption, and Trade of Ethanol
Trend of total ethanol fuel production and consumption from 2000 to 2023 Last update October 2024
-
-
-
U.S. Production, Consumption, and Trade of Petroleum Products
Trend of total petroleum product production, consumption, and trade from 1949 to 2023 Last update November 2023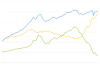
-
-
-
U.S. Renewable Diesel Imports
Renewable diesel fuel imports to the United States from 2015 to 2023 Last update October 2024
-
-
Fuels & Infrastructure: Emissions
-
-
Greenhouse Gas Emissions by Economic Sector
Trend of U.S. greenhouse gas emission for each economic sector Last update May 2024
-
-
Fuels & Infrastructure: Alternative Fueling Stations
-
-
Biodiesel Fueling Station Locations by State
Displays states and their respective biodiesel station counts
-
-
-
Compressed Natural Gas Fueling Stations by State
Displays states and their respective compressed natural gas (CNG) station counts
-
-
-
E85 Fueling Station Locations by State
Displays states and their respective E85 station counts
-
-
-
Electric Vehicle Charging Ports by State
Displays states and their respective EV charging port counts
-
-
-
Hydrogen Fueling Station Locations by State
Displays states and their respective hydrogen station counts
-
-
-
Liquefied Natural Gas Fueling Stations by State
Displays states and their respective liquefied natural gas (LNG) station counts
-
-
-
Propane Fueling Station Locations by State
Displays states and their respective propane station counts
-
-
-
Renewable Diesel Fueling Station Locations by State
Displays states and their respective renewable diesel station counts
-

Change in U.S. Light-Duty Vehicle Registration Counts
| 2016-2017 | 2017-2018 | 2018-2019 | 2019-2020 | 2020-2021 | 2021-2022 | 2022-2023 | |
| Gasoline | 1.1 | 0.7 | 1 | 0.3 | 3.6 | 0.3 | -1.5 |
| Flex Fuel | 10 | 6.4 | 4.5 | 1.6 | -32.1 | -1.4 | -10 |
| Diesel | 4.7 | 2 | 3.2 | 3.5 | -24.6 | 0.6 | -1.7 |
| Hybrid Electric | 7.3 | 4.9 | 6 | 6.3 | 12.8 | 12.2 | 8.7 |
| Electric | 25.9 | 33.7 | 26.9 | 23.1 | 29.9 | 40.3 | 21.5 |
| Biodiesel | 13.1 | 1.4 | |||||
| PHEV | 26.3 | 25.3 | 14 | 9.7 | 21.5 | 25.3 | 11.5 |
| Compressed Natural Gas | -8.8 | -8.9 | -8.7 | -7.5 | -135 | -16.1 | |
| Hydrogen | 59.6 | 34.1 | 62 | 9.4 | -18.2 | 20.5 | 8.4 |
| Propane | 5.3 | -58.3 | -20 | 9.1 | 99.9 | -7.2 | -8.9 |
| Bi-Fuel | -43.3 | ||||||
| Other | -0.3 | -3.9 | -4.7 | -5.8 | -10.5 | ||
| Unspecified | -6.9 | -4.5 | -2.4 | -4.7 |
Source: Vehicle registration counts derived by the National Renewable Energy Laboratory with data from Experian Information Solutions
Notes: Bi-Fuel includes vehicles that can run on two fuel types in the same engine but is susceptible to differences in reporting. (Ex. CNG ~ Gas, Natural Gas ~ Propane)
The chart illustrates the annual percent change of light-duty vehicles, by fuel type, registered in the United States from 2016 through 2023. Hydrogen fuel cell vehicles (HFCVs) consistently showed the greatest growth in registration counts until 2020. This is largely because initial vehicle registration counts were low. Annual changes are more volatile for vehicle fuel types with small populations, such as hydrogen, compressed natural gas, and propane. From 2016 to 2023, the highest average percentage increases are from electric vehicles with 28.8%, HFCVs with 25.1%, and Plug-in Hybrid Electric Vehicles (PHEVs) with 19.09%. The largest percent decrease is found in compressed natural gas vehicles, averaging -174% because of very limited fueling stations. See relative vehicle population sizes at Light-Duty AFV Registrations, AFV and HEV Model Offerings, by Manufacturer, U.S. Plug-in Electric Vehicle Sales by Model, and the Energy Information Administration's Fleet and Fuel Data. For a map comparing the density of light-duty vehicles per state and charts comparing registration counts over time, see TransAtlas.
To view more details, notes, and acronyms, please download the Excel spreadsheet.
Print