Maps and Data - Change in U.S. Vehicle Registration Counts
Find maps and charts showing transportation data and trends related to alternative fuels and vehicles.
OR
Sort by:
119 results
-
Fuels & Infrastructure: Alternative Fueling Stations
-
-
U.S. Private Electric Vehicle Charging Infrastructure
Trend of private electric vehicle charging infrastructure in the United States from 2007 to 2023 Last update March 2024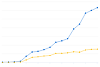
-
-
-
U.S. Public and Private Alternative Fueling Stations by Fuel Type
Trend of alternative fueling station counts by fuel type in the United States from 1992 to 2022 Last update January 2023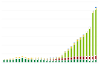
-
-
-
U.S. Public and Private Electric Vehicle Charging Infrastructure
Trend of public and private electric vehicle charging infrastructure in the United States from 2011 to 2023 Last update March 2024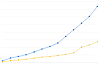
-
-
-
U.S. Public Electric Vehicle Charging Infrastructure
Trend of public electric vehicle charging infrastructure in the United States from 2007 to 2023 Last update March 2024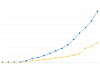
-
-
Fuels & Infrastructure: Idle Reduction
-
-
Clean Cities and Communities Energy Use Impact through Idle Reduction
Trend of energy impact by idle reduction policies and technologies from 2004 to 2022 Last update February 2024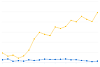
-
-
Fuels & Infrastructure: Transportation Infrastructure
-
-
Miles of U.S. Transportation Infrastructure in 2021
Distance covered by different types of transportation infrastructure in 2021 Last update January 2024
-
-
Fuels & Infrastructure: Biofuels Production
-
-
Global Ethanol Production by Country or Region
Quantity of ethanol produced by country/region from 2007 to 2022 Last update January 2024
-
-
-
Legislated Renewable Fuel Standard (RFS) Volume Requirements
Displays the yearly RFS volume requirements for each renewable fuel category Last update January 2024
-
-
-
Renewable Fuel RFS2 Mandates and Net RINs Generated
Displays yearly Renewable Fuel Standard (RFS) mandates from Environmental Protection Agency (EPA) volume requirements, and net Renewable Identification Numbers (RINs) generated Last update April 2024
-
-
-
RFS2 Mandates and Net RINs Generated for Cellulosic Biofuels
Displays yearly Renewable Fuel Standard (RFS) mandates from Environmental Protection Agency (EPA) volume requirements, and net Renewable Identification Numbers (RINs) generated Last update April 2024
-
-
-
Total Advanced Biofuel RFS2 Mandates and Net RINs Generated
Displays yearly Renewable Fuel Standard (RFS) mandates from Environmental Protection Agency (EPA) volume requirements, and net Renewable Identification Numbers (RINs) generated Last update April 2024
-
-
-
Total RFS2 Mandates and Net RINs Generated
Displays yearly Renewable Fuel Standard (RFS) mandates from Environmental Protection Agency (EPA) volume requirements, and net Renewable Identification Numbers (RINs) generated Last update April 2024
-
-
-
U.S. Biodiesel Production, Exports, and Consumption
Trend of biodiesel production, exports, and consumption from 2001 to 2023 Last update April 2024
-
-
-
U.S. Corn Production and Portion Used for Fuel Ethanol
Trend of corn produced in the United States and quantity used for ethanol from 1986 to 2023 Last update January 2024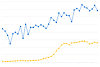
-
-
-
U.S. Corn Use by Market Year
Annual usage of the U.S. corn crop according to end product or destination Last update January 2024
-
-
-
U.S. Ethanol Plants, Capacity, and Production
Trend of ethanol plant counts and production volumes from 1999 to 2022 Last update April 2024
-
-
-
U.S. Production, Consumption, and Trade of Ethanol
Trend of total ethanol fuel production and consumption from 2000 to 2023 Last update April 2024
-
-
-
U.S. Soybean and Corn Prices
Trend of soybean and corn prices, adjusted for inflation, from 2002 to 2021 Last update January 2023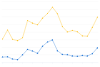
-
-
Vehicles
-
-
Efficiency Ratios for Light-Duty All-Electric Vehicles in the United States
Provides efficiency ratios of on-road all-electric vehicles in the United States in 2021, based on vehicle registration data. Last update June 2023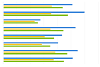
-
-
-
Electric Vehicle Registrations by State
U.S. light-duty electric vehicle population as of December 2022 Last update July 2023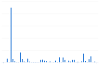
-
-
-
TransAtlas
Interactive map displays light-duty vehicle registration counts over time by state and fuel type
-
-
Vehicles: AFVs and HEVs
-
-
AFV Acquisitions by Regulated Fleets (by Fleet Type)
Trend of State & Alternative Fuel Provider (S&FP) alternative fuel vehicle (AFV) acquisitions by fleet type from 1992 to 2022 Last update June 2023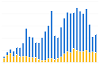
-
-
-
AFV Acquisitions by Regulated Fleets (by Fuel Type)
Trend of State & Alternative Fuel Provider (S&FP) alternative fuel vehicle (AFV) acquisitions by fuel type from 1992 to 2022 Last update June 2023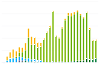
-
-
-
AFV and HEV Model Offerings, by Manufacturer
Trend of alternative fuel vehicle (AFV) and hybrid electric vehicle (HEV) models by manufacturer, 1991-2024 Last update May 2024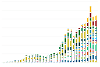
-
-
-
Annual Vehicle Credits Earned and Used by Regulated Fleets
Trend of State & Alternative Fuel Provider (S&FP) EPAct credits traded and transactions from 1999 to 2022 Last update June 2023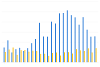
-

Change in U.S. Vehicle Registration Counts
| 2016-2017 | 2017-2018 | 2018-2019 | 2019-2020 | |
| Alternative Fuel Capable | -0.311769290724864 | -3.86561424812791 | -4.73767885532591 | -5.79726396052927 |
| Compressed Natural Gas | -8.84534968969772 | -8.85858935852614 | -8.65559098362557 | -7.46064037642583 |
| Diesel | 4.69984214377891 | 1.98642744385297 | 3.16481506495663 | 3.49561962667283 |
| Electric | 25.9045643481214 | 33.6629704007684 | 26.9357279378179 | 23.11619160476 |
| Flex Fuel | 10.0338947316746 | 6.39404393887671 | 4.54777243425884 | 1.63100296477805 |
| Gasoline | 1.12594765582387 | 0.723982358720709 | 0.987537347016061 | 0.272988968877129 |
| Hybrid Electric | 7.28839886548426 | 4.86541186376394 | 6.00000132946341 | 6.25129958440303 |
| Hydrogen Fuel Cell | 59.5684803001876 | 34.0890354492993 | 62.0195694716243 | 9.37145289443814 |
| Methanol | -15.4213036565978 | -21.8992248062016 | -20.5607476635514 | -12.9287598944591 |
| Plug-In Hybrid Electric | 26.3439253095897 | 25.3166093377809 | 14.0066949724336 | 9.66259140710109 |
| Propane | 5.26315789473684 | -58.3333333333333 | -20 | 9.09090909090909 |
Source: Vehicle registration counts derived by the National Renewable Energy Laboratory with data from Experian Information Solutions
Notes: "Alternative Fuel Capable" vehicles are those with the capability of being converted to an alternative fuel. The data do not confirm whether the vehicle actually completed a conversion.
The chart illustrates the annual percent change of light-duty vehicles, by fuel type, registered in the United States from 2016 through 2020. Hydrogen fuel cell vehicles (HFCVs) consistently show the greatest growth in registration counts over the four-year period. However, the base number of vehicles was very low, and the rate of increase peaked in 2019 when the registration counts of HFCVs increased by more than 60% and has been steadily decreasing since. This is likely from increased production of the Toyota Mirai and the Honda Clarity Fuel Cell models in efforts to improve market share. Plug-in hybrid electric and electric vehicles have maintained steady growth, averaging around 35% year over year for the past four years. Annual changes are more volatile for vehicle fuel types with small populations, such as hydrogen, methanol and propane. See relative vehicle population sizes at Light-Duty AFV Registrations, AFV and HEV Model Offerings, by Manufacturer, U.S. Plug-in Electric Vehicle Sales by Model, and the Energy Information Administration's Fleet and Fuel Data. For a map comparing the density of light-duty vehicles per state and charts comparing registration counts over time, see TransAtlas.
To view more details, notes, and acronyms, please download the Excel spreadsheet.
Print