Maps and Data - Greenhouse Gas Reductions in Light- and Heavy-Duty Vehicles
Find maps and charts showing transportation data and trends related to alternative fuels and vehicles.
OR
Sort by:
119 results
-
Laws & Incentives
-
-
Natural Gas Laws and Incentives by State
Displays states and their respective law and incentive counts related to the use of natural gas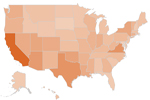
-
-
-
Propane Laws and Incentives by State
Displays states and their respective law and incentive counts related to the use of propane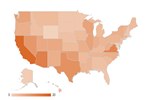
-
-
-
Renewable Diesel Laws and Incentives by State
Displays states and their respective law and incentive counts related to the use of renewable diesel
-
-
Clean Cities and Communities
-
-
Clean Cities and Communities Coalition Locations
Displays coalition locations and boundaries across the United States Last update April 2024
-
-
-
Clean Cities and Communities Project Awards and Matching Funds
Trend of competitive project awards and matching funds from 1998 to 2022 Last update February 2024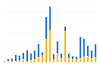
-
-
Clean Cities and Communities: Vehicles
-
-
Clean Cities and Communities Alternative Fuel Vehicle Inventory
Alternative fuel vehicle inventory reported by Clean Cities and Communities coalitions from 2004 to 2022 Last update February 2024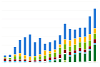
-
-
-
Clean Cities and Communities Energy Use Impact by AFV Type
Trend of energy impact by fuels used in alternative fuel vehicles (AFVs) from 2004 to 2022 Last update February 2024
-
-
Clean Cities and Communities: Energy Use Impact
-
-
Clean Cities and Communities Annual Energy Use Impact
Trend of reduced fuel use and increased fuel diversity from 1994 to 2022 Last update February 2024
-
-
-
Clean Cities and Communities Cumulative Energy Use Impact
Cumulative trend of reduced fuel use and increased fuel diversity from 1994 to 2022 Last update February 2024
-
-
-
Clean Cities and Communities Energy Use Impact by AFV Type
Trend of energy impact by fuels used in alternative fuel vehicles (AFVs) from 2004 to 2022 Last update February 2024
-
-
-
Clean Cities and Communities Energy Use Impact by VMT Reduction and FE
Trend of energy impact by fuel economy (FE) improvements and reductions in vehicle miles traveled (VMT) from 2004 to 2022 Last update February 2024
-
-
-
Clean Cities and Communities Energy Use Impact through Idle Reduction
Trend of energy impact by idle reduction policies and technologies from 2004 to 2022 Last update February 2024
-
-
Regulated Fleets: State & Alt Fuel Providers
-
-
AFV Acquisitions by Regulated Fleets (by Fleet Type)
Trend of State & Alternative Fuel Provider (S&FP) alternative fuel vehicle (AFV) acquisitions by fleet type from 1992 to 2022 Last update June 2023
-
-
-
AFV Acquisitions by Regulated Fleets (by Fuel Type)
Trend of State & Alternative Fuel Provider (S&FP) alternative fuel vehicle (AFV) acquisitions by fuel type from 1992 to 2022 Last update June 2023
-
-
-
Annual Vehicle Credits Earned and Used by Regulated Fleets
Trend of State & Alternative Fuel Provider (S&FP) EPAct credits traded and transactions from 1999 to 2022 Last update June 2023
-
-
-
Biodiesel Purchases by EPAct-Regulated Fleets
Trend of State and Alternative Fuel Provider Biodiesel Purchases from 2000 to 2022 Last update June 2023
-
-
-
EPAct State & Alternative Fuel Provider Fleet Exemptions
Trend of State & Alternative Fuel Provider (S&FP) exemption requests and vehicles exempted from 1997 to 2022 Last update June 2023
-
-
-
Vehicle Credits Traded by Regulated Fleets
Trend of State & Alternative Fuel Provider (S&FP) EPAct credits traded and transactions from 1997 to 2022 Last update June 2023
-
-
Regulated Fleets: Federal Fleets
-
-
AFV Requirements, Acquisitions, and Credits for Federal Agencies
Displays EPAct alternative fuel vehicle (AFV) acquisition requirements, total AFV acquisitions, and additional credits toward the acquisition requirements for federal agencies from fiscal years 2000 through 2023 Last update April 2024
-

Greenhouse Gas Reductions in Light- and Heavy-Duty Vehicles
| Gasoline | Diesel | Propane | LNG | CNG | Ethanol (Corn) | H2 (SMR) | Electricity | Biodiesel | Renewable Diesel | RNG (Landfill) | Fuel Economy | Idle Reduction | VMT Reduction | RNG (Animal) | RNG (Wastewater) | |
| Light-Duty Vehicles | 0 | -13 | -16 | -40 | -43 | -61 | -68 | -80 | -84 | -100 | -100 | -100 | -130 | -146 | ||
| Heavy-Duty Vehicles | 0 | 3 | -3 | -7 | -46 | -61 | -61 | -76 | -83 | -100 | -100 | -100 | -133 | -151 |
Source: Derived from AFLEET 2020 for the Clean Cities and Communities Coalition Network. Data reflect input values deemed applicable to the average or majority of U.S. drivers at a national level.
This figure compares the greenhouse gases (GHGs) emitted by various fuels over their lifecycle when achieving the same transportation objectives. Propane and CNG emit 13% and 16% fewer GHGs than conventional gasoline in light-duty vehicles (LDVs). Corn ethanol and hydrogen produced from steam-methane reforming (currently the most common source of hydrogen) both reduce emissions about 40% over their lifecycles. Electricity (assuming the nationwide average grid mix) and biodiesel both reduce emissions by more than 60%. Fuel economy, idle reduction, and VMT-reduction projects all reduce GHG emissions 100% because they have no alternative or upstream emissions. Renewable natural gas reduces emissions by 84%-146%, depending on the source, because these projects keep methane from venting to the atmosphere. Greenhouse gas reductions from heavy-duty vehicles (HDVs) are similar to those of LDVs, but slightly smaller because diesel engines (which are the baseline for this chart) are more efficient than gasoline engines.
To view more details, notes, and acronyms, please download the Excel spreadsheet.
Print