Oregon Transportation Data for Alternative Fuels and Vehicles
Find transportation data and information about alternative fuels and advanced vehicles in Oregon, including laws and incentives, fueling stations, fuel prices, and more.
Laws and Incentives
67
laws and incentives in Oregon related to alternative fuels and advanced vehicles
Recent Additions and Updates
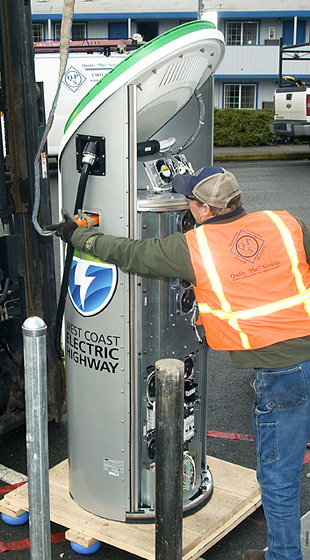
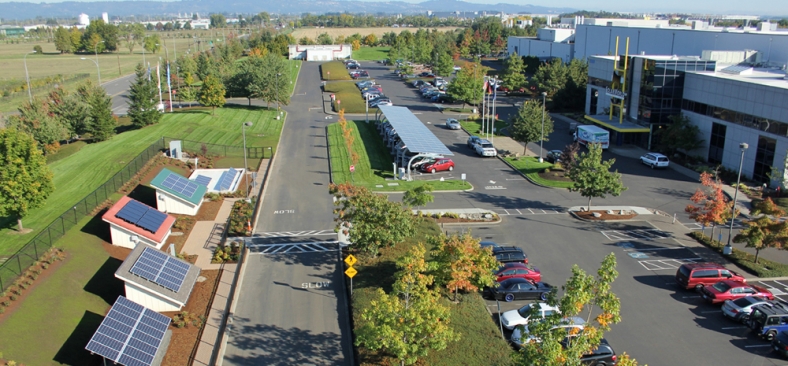
Fueling Stations
4,799
stations in Oregon with alternative fuels
| Fuel | Public | Private |
|---|---|---|
| Biodiesel (B20 and above) | 67 | 0 |
| Compressed Natural Gas (CNG) | 1 | 8 |
| Electric (charging ports) | 4,301 | 303 |
| Ethanol (E85) | 4 | 0 |
| Hydrogen | 0 | 0 |
| Liquefied Natural Gas (LNG) | 0 | 0 |
| Propane (LPG) | 30 | 1 |
| Renewable Diesel (R20 and above) | 82 | 2 |
Clean Cities and Communities Coalitions
Clean Cities and Communities is a U.S. Department of Energy partnership to foster transportation energy choices nationwide.
Oregon has 1 coalition:
Columbia-Willamette Clean Cities
Contact a local coalition or regional manager for project assistance or to connect with other local stakeholders.
Transportation Fuel Consumption
Source: State Energy Data System based on beta data converted to gasoline gallon equivalents of petroleum (GGEs) for the transportation sector (which includes more than highway vehicles) from the U.S. Energy Information Administration
Vehicles Registered in 2024
| Electric (EV) | 78,400 |
| Plug-In Hybrid Electric (PHEV) | 33,200 |
| Hybrid Electric (HEV) | 171,400 |
| Biodiesel | 59,600 |
| Ethanol/Flex (E85) | 183,100 |
| Compressed Natural Gas (CNG) | 100 |
| Propane | 100 |
| Hydrogen | 0 |
| Methanol | 0 |
| Gasoline | 3,059,000 |
| Diesel | 216,000 |
| Unknown Fuel | 49,300 |
Source: Light-duty vehicle registration counts from TransAtlas with data from Experian Information Solutions
Case Studies


Regional Fuel Prices
Average fuel prices as of October 2025
| Fuel | West Coast Region | National Average | ||
|---|---|---|---|---|
| per unit sold | per GGE | per unit sold | per GGE | |
| Biodiesel (B20) | $4.40/gallon | $4.00/GGE | $3.74/gallon | $3.40/GGE |
| Biodiesel (B99–B100) | $4.52/gallon | $4.47/GGE | $4.30/gallon | $4.26/GGE |
| Ethanol (E85) | $3.45/gallon | $4.86/GGE | $2.63/gallon | $3.71/GGE |
| Natural Gas (CNG) | $3.51/GGE | $3.51/GGE | $2.96/GGE | $2.96/GGE |
| Propane | $3.55/gallon | $4.90/GGE | $3.42/gallon | $4.72/GGE |
| Gasoline | $4.43/gallon | $4.43/GGE | $3.14/gallon | $3.14/GGE |
| Diesel | $4.85/gallon | $4.37/GGE | $3.74/gallon | $3.37/GGE |
Source: Average prices per gasoline gallon equivalent (GGE) for the West Coast PADD from the Alternative Fuel Price Report
Transportation Projects
- Affordable Mobility Platform
- Assuring Equitable Access and Building Technical Capacity for Transportation Decarbonization Among Native Nations
- Development of a National Liquid Propane (Autogas) Refueling Network, Clean School Bus/Vehicle Incentive, and Green Jobs Outreach Program
- Energizing Oregon
- Expanding Access to Charging at Home (EACH) Program
- Helping Rural Counties Transition to Cleaner Fuels and Vehicles
- Improved safety and reduced cost in handling and transporting reclaimed lithium-ion batteries
- Making the Business Case for Smart, Shared, and Sustainable Mobility Services
- Maryland Hybrid Truck Goods Movement Initiative
- Microgrid Opportunities: Vehicles Enhancing Resiliency (MOVER)
- No One Silver Bullet, But a Lot of Silver Beebees
- Northwest Electric Showcase Project (Drive Oregon)
- Puget Sound Clean Cities Coalition Petroleum Reduction Project
- The Clean Rural Shared Electric Mobility Project
- Using a Joint Procurement Process to Increase ZEV Adoption Nationwide
- WestSmart EV@Scale: Western Smart Plug-in Electric Vehicle Community Partnership
- WestSmartEV: Western Smart Plug-in Electric Vehicle Community Partnership
Electricity Sources and Vehicle Emissions
Source: Electricity Sources and Emissions Tool based on assumptions with 2024 data from EIA
More Resources
- Oregon Data – U.S. Energy Information Administration
- Oregon State Energy Office
- Oregon Electric Vehicle Charging Plan
- Oregon – National Association of State Energy Officials (NASEO)
- Maps and Data – Alternative Fuels Data Center
- Maps – National Laboratory of the Rockies
- Electric Vehicle Infrastructure Toolbox (EVI-X)
- State Electrification Planning and Funding