Maryland Transportation Data for Alternative Fuels and Vehicles
Find transportation data and information about alternative fuels and advanced vehicles in Maryland, including laws and incentives, fueling stations, fuel prices, and more.
Laws and Incentives
56
laws and incentives in Maryland related to alternative fuels and advanced vehicles
Recent Additions and Updates
Fueling Stations
6,318
stations in Maryland with alternative fuels
| Fuel | Public | Private |
|---|---|---|
| Biodiesel (B20 and above) | 0 | 25 |
| Compressed Natural Gas (CNG) | 6 | 6 |
| Electric (charging ports) | 5,539 | 631 |
| Ethanol (E85) | 59 | 13 |
| Hydrogen | 0 | 0 |
| Liquefied Natural Gas (LNG) | 0 | 0 |
| Propane (LPG) | 21 | 18 |
| Renewable Diesel (R20 and above) | 0 | 0 |
Clean Cities and Communities Coalitions
Clean Cities and Communities is a U.S. Department of Energy partnership to foster transportation energy choices nationwide.
Maryland has 1 coalition:
Maryland Clean Cities and Communities Coalition
Contact a local coalition or regional manager for project assistance or to connect with other local stakeholders.
Transportation Fuel Consumption
Source: State Energy Data System based on beta data converted to gasoline gallon equivalents of petroleum (GGEs) for the transportation sector (which includes more than highway vehicles) from the U.S. Energy Information Administration
Vehicles Registered in 2024
| Electric (EV) | 94,900 |
| Plug-In Hybrid Electric (PHEV) | 36,600 |
| Hybrid Electric (HEV) | 191,800 |
| Biodiesel | 33,600 |
| Ethanol/Flex (E85) | 297,500 |
| Compressed Natural Gas (CNG) | 200 |
| Propane | 0 |
| Hydrogen | 0 |
| Methanol | 0 |
| Gasoline | 4,261,500 |
| Diesel | 84,800 |
| Unknown Fuel | 31,000 |
Source: Light-duty vehicle registration counts from TransAtlas with data from Experian Information Solutions

Videos
Maryland State Fleet Commits to Electric Vehicles
June 22, 2022
Aging Hybrid Vehicles Charge Forward with New Batteries
Sept. 3, 2021
Electric Vehicles Hit the Open Road
April 27, 2019
Maryland County Fleet Uses Wide Variety of Alternative Fuels
Jan. 17, 2015
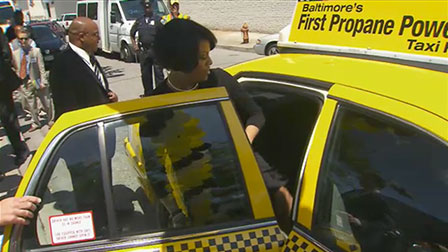
Veolia Transportation Converts Taxi Fleet to Propane
Aug. 17, 2013
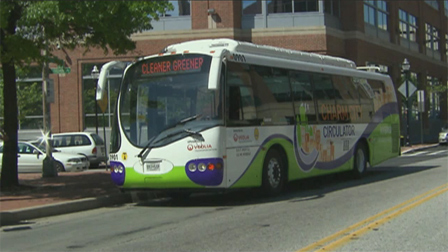
Hybrid Electric Shuttle Buses Offer Free Rides in Maryland
June 18, 2010
Regional Fuel Prices
Average fuel prices as of October 2025
| Fuel | Central Atlantic Region | National Average | ||
|---|---|---|---|---|
| per unit sold | per GGE | per unit sold | per GGE | |
| Biodiesel (B20) | $3.95/gallon | $3.59/GGE | $3.74/gallon | $3.40/GGE |
| Ethanol (E85) | $2.61/gallon | $3.68/GGE | $2.63/gallon | $3.71/GGE |
| Natural Gas (CNG) | $2.81/GGE | $2.81/GGE | $2.96/GGE | $2.96/GGE |
| Propane | $3.54/gallon | $4.89/GGE | $3.42/gallon | $4.72/GGE |
| Gasoline | $2.91/gallon | $2.91/GGE | $3.14/gallon | $3.14/GGE |
| Diesel | $3.62/gallon | $3.26/GGE | $3.74/gallon | $3.37/GGE |
Source: Average prices per gasoline gallon equivalent (GGE) for the Central Atlantic PADD from the Alternative Fuel Price Report
Transportation Projects
- Advancing Alternative Fuel Markets Adoption and Growth
- Aggregated Alternative Technology Alliance
- Catoctin Mountain Park
- East Coast Commercial Zero-Emissions Vehicle Corridor Planning Partnership
- Electric Vehicle Widescale Analysis for Tomorrow's Transportation Solutions (EV WATTS)
- Maryland Hybrid Truck Goods Movement Initiative
- Mid-Atlantic Electric School Bus Experience Project
- No One Silver Bullet, But a Lot of Silver Beebees
- Northeast Electric Vehicle Initiative
- Penske Truck Leasing Alternative Fuel Vehicle (AFV) Demonstration and Enhanced Driver Experience
- Southeast Propane Autogas Development Program
- Transportation energy analytics dashboard
- Using a Joint Procurement Process to Increase ZEV Adoption Nationwide
Electricity Sources and Vehicle Emissions
Source: Electricity Sources and Emissions Tool based on assumptions with 2024 data from EIA
More Resources
- Maryland Data – U.S. Energy Information Administration
- Maryland State Energy Office
- Maryland Electric Vehicle Charging Plan
- Maryland – National Association of State Energy Officials (NASEO)
- Maps and Data – Alternative Fuels Data Center
- Maps – National Laboratory of the Rockies
- Electric Vehicle Infrastructure Toolbox (EVI-X)
- State Electrification Planning and Funding