Oklahoma Transportation Data for Alternative Fuels and Vehicles
Find transportation data and information about alternative fuels and advanced vehicles in Oklahoma, including laws and incentives, fueling stations, fuel prices, and more.
Laws and Incentives
59
laws and incentives in Oklahoma related to alternative fuels and advanced vehicles
Recent Additions and Updates
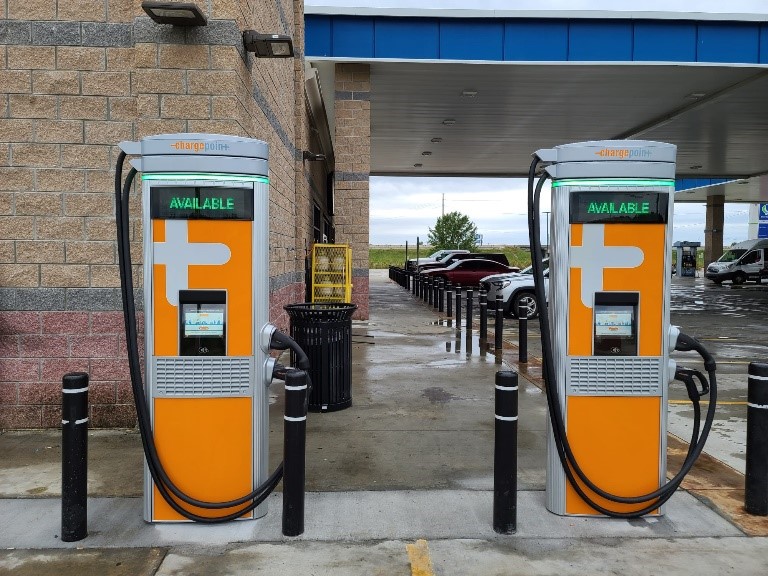
Fueling Stations
2,242
stations in Oklahoma with alternative fuels
| Fuel | Public | Private |
|---|---|---|
| Biodiesel (B20 and above) | 15 | 0 |
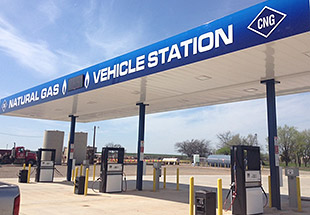
| Compressed Natural Gas (CNG) | 73 | 21 |
| Electric (charging ports) | 1,610 | 264 |
| Ethanol (E85) | 96 | 3 |
| Hydrogen | 0 | 0 |
| Liquefied Natural Gas (LNG) | 0 | 0 |
| Propane (LPG) | 145 | 15 |
| Renewable Diesel (R20 and above) | 0 | 0 |
Clean Cities and Communities Coalitions
Clean Cities and Communities is a U.S. Department of Energy partnership to foster transportation energy choices nationwide.
Oklahoma has 2 coalitions:
Central Oklahoma Clean Cities Coalition (Oklahoma City)
Contact a local coalition or regional manager for project assistance or to connect with other local stakeholders.
Transportation Fuel Consumption
Source: State Energy Data System based on beta data converted to gasoline gallon equivalents of petroleum (GGEs) for the transportation sector (which includes more than highway vehicles) from the U.S. Energy Information Administration
Vehicles Registered in 2024
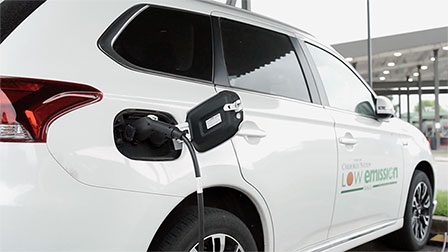
| Electric (EV) | 22,600 |
| Plug-In Hybrid Electric (PHEV) | 34,300 |
| Hybrid Electric (HEV) | 73,000 |
| Biodiesel | 65,900 |
| Ethanol/Flex (E85) | 343,200 |
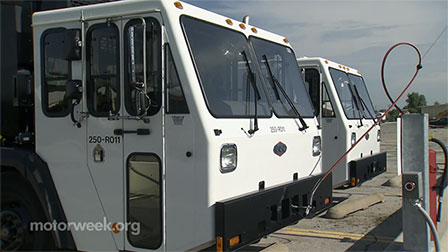
| Compressed Natural Gas (CNG) | 1,700 |
| Propane | 200 |
| Hydrogen | 0 |
| Methanol | 0 |
| Gasoline | 3,506,700 |
| Diesel | 146,500 |
| Unknown Fuel | 44,000 |
Source: Light-duty vehicle registration counts from TransAtlas with data from Experian Information Solutions
Regional Fuel Prices
Average fuel prices as of October 2025
| Fuel | Midwest Region | National Average | ||
|---|---|---|---|---|
| per unit sold | per GGE | per unit sold | per GGE | |
| Biodiesel (B20) | $3.25/gallon | $2.96/GGE | $3.74/gallon | $3.40/GGE |
| Ethanol (E85) | $2.49/gallon | $3.51/GGE | $2.63/gallon | $3.71/GGE |
| Natural Gas (CNG) | $2.75/GGE | $2.75/GGE | $2.96/GGE | $2.96/GGE |
| Propane | $3.54/gallon | $4.89/GGE | $3.42/gallon | $4.72/GGE |
| Gasoline | $2.86/gallon | $2.86/GGE | $3.14/gallon | $3.14/GGE |
| Diesel | $3.58/gallon | $3.22/GGE | $3.74/gallon | $3.37/GGE |
Source: Average prices per gasoline gallon equivalent (GGE) for the Midwest PADD from the Alternative Fuel Price Report
Transportation Projects
- I-40 Collaboration of Clean Cities
- Drive Electric USA 2
- Filling Critical Gaps through Innovative Cradle-to-Grave Training
- Guaranteeing Access to Underserved and Marginalized Populations by Building Employment Opportunities (GUMBO)
- Maryland Hybrid Truck Goods Movement Initiative
- NFPA Spurs the Safe Adoption of Electric Vehicles through Education and Outreach
- NGV U.P.T.I.M.E. Analysis: Updated Performance Tracking Integrating Maintenance Expenses
- No One Silver Bullet, But a Lot of Silver Beebees
- Safety Training and Design, Permitting, and Operational Guidance for Garage Facilities Maintaining and Parking Natural Gas, Propane, and Hydrogen Vehicles
Electricity Sources and Vehicle Emissions
Source: Electricity Sources and Emissions Tool based on assumptions with 2024 data from EIA
More Resources
- Oklahoma Data – U.S. Energy Information Administration
- Oklahoma State Energy Office
- Oklahoma Electric Vehicle Charging Plan
- Oklahoma – National Association of State Energy Officials (NASEO)
- Maps and Data – Alternative Fuels Data Center
- Maps – National Laboratory of the Rockies
- Electric Vehicle Infrastructure Toolbox (EVI-X)
- State Electrification Planning and Funding