Minnesota Transportation Data for Alternative Fuels and Vehicles
Find transportation data and information about alternative fuels and advanced vehicles in Minnesota, including laws and incentives, fueling stations, fuel prices, and more.
Laws and Incentives
80
laws and incentives in Minnesota related to alternative fuels and advanced vehicles
Recent Additions and Updates
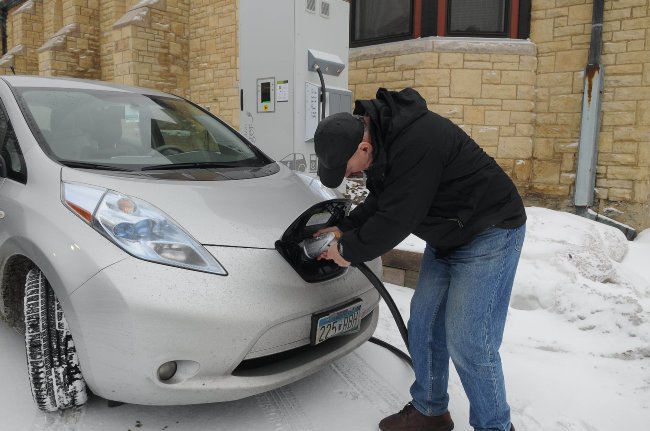
Fueling Stations
4,193
stations in Minnesota with alternative fuels
| Fuel | Public | Private |
|---|---|---|
| Biodiesel (B20 and above) | 284 | 2 |
| Compressed Natural Gas (CNG) | 9 | 9 |
| Electric (charging ports) | 3,282 | 157 |
| Ethanol (E85) | 388 | 9 |
| Hydrogen | 0 | 0 |
| Liquefied Natural Gas (LNG) | 0 | 0 |
| Propane (LPG) | 47 | 6 |
| Renewable Diesel (R20 and above) | 0 | 0 |
Clean Cities and Communities Coalitions
Clean Cities and Communities is a U.S. Department of Energy partnership to foster transportation energy choices nationwide.
Minnesota has 1 coalition:
Minnesota Clean Cities Coalition
Contact a local coalition or regional manager for project assistance or to connect with other local stakeholders.
Transportation Fuel Consumption
Source: State Energy Data System based on beta data converted to gasoline gallon equivalents of petroleum (GGEs) for the transportation sector (which includes more than highway vehicles) from the U.S. Energy Information Administration
Vehicles Registered in 2025
| Electric (EV) | 59,800 |
| Plug-In Hybrid Electric (PHEV) | 24,800 |
| Hybrid Electric (HEV) | 219,000 |
| Biodiesel | 62,200 |
| Ethanol/Flex (E85) | 493,600 |
| Compressed Natural Gas (CNG) | 100 |
| Propane | 0 |
| Hydrogen | 0 |
| Methanol | 0 |
| Gasoline | 4,239,100 |
| Diesel | 125,700 |
| Unknown Fuel | 23,000 |
Source: Light-duty vehicle registration counts from TransAtlas with data from Experian Information Solutions
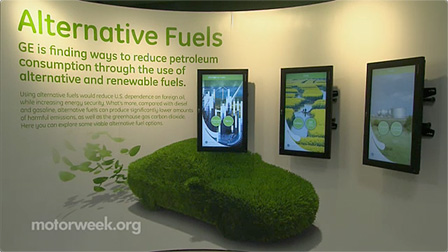
Videos

Regional Fuel Prices
Average fuel prices as of October 2025
| Fuel | Midwest Region | National Average | ||
|---|---|---|---|---|
| per unit sold | per GGE | per unit sold | per GGE | |
| Biodiesel (B20) | $3.25/gallon | $2.96/GGE | $3.74/gallon | $3.40/GGE |
| Ethanol (E85) | $2.49/gallon | $3.51/GGE | $2.63/gallon | $3.71/GGE |
| Natural Gas (CNG) | $2.75/GGE | $2.75/GGE | $2.96/GGE | $2.96/GGE |
| Propane | $3.54/gallon | $4.89/GGE | $3.42/gallon | $4.72/GGE |
| Gasoline | $2.86/gallon | $2.86/GGE | $3.14/gallon | $3.14/GGE |
| Diesel | $3.58/gallon | $3.22/GGE | $3.74/gallon | $3.37/GGE |
Source: Average prices per gasoline gallon equivalent (GGE) for the Midwest PADD from the Alternative Fuel Price Report
Transportation Projects
- Accelerating Alternatives for Minnesota Drivers
- Cold-Weather Operation, Observation, and Learning Electric Vehicles (COOL EVs)
- Drive Electric USA 2
- Electric Vehicle Smart Program Management: Supporting Local Governments to Achieve Equitable Access to Electric Mobility
- Expanding Regional Electric Vehicle Charging Access with Tribal Nations Based on Community Priorities
- Guaranteeing Access to Underserved and Marginalized Populations by Building Employment Opportunities (GUMBO)
- Maryland Hybrid Truck Goods Movement Initiative
- Midwest EVOLVE (Midwest Electric Vehicle Opportunities: Learning, Events, Experience
- Mississippi National River and Recreation Area
- No One Silver Bullet, But a Lot of Silver Beebees
- Organizing and Supporting Underserved Communities to Design, Implement, and Use Electric Vehicle Charging Infrastructure
- Twin Cities Electric Vehicle Community Mobility Network
- U.S. Fuels Across America’s Highways - Michigan to Montana (M2M)
- Upper Midwest Inter-Tribal Electric Vehicle Charging Community Network
Electricity Sources and Vehicle Emissions
Source: Electricity Sources and Emissions Tool based on assumptions with 2024 data from EIA
More Resources
- Minnesota Data – U.S. Energy Information Administration
- Minnesota State Energy Office
- Minnesota Electric Vehicle Charging Plan
- Minnesota – National Association of State Energy Officials (NASEO)
- Maps and Data – Alternative Fuels Data Center
- Maps – National Laboratory of the Rockies
- Electric Vehicle Infrastructure Toolbox (EVI-X)
- State Electrification Planning and Funding