California Transportation Data for Alternative Fuels and Vehicles
Find transportation data and information about alternative fuels and advanced vehicles in California, including laws and incentives, fueling stations, fuel prices, and more.
Laws and Incentives
235
laws and incentives in California related to alternative fuels and advanced vehicles
Recent Additions and Updates
Fueling Stations
79,610
stations in California with alternative fuels
| Fuel | Public | Private |
|---|---|---|
| Biodiesel (B20 and above) | 453 | 26 |
| Compressed Natural Gas (CNG) | 170 | 160 |
| Electric (charging ports) | 65,573 | 11,072 |
| Ethanol (E85) | 646 | 21 |
| Hydrogen | 48 | 3 |
| Liquefied Natural Gas (LNG) | 11 | 24 |
| Propane (LPG) | 201 | 45 |
| Renewable Diesel (R20 and above) | 1,143 | 14 |
Clean Cities and Communities Coalitions
Clean Cities and Communities is a U.S. Department of Energy partnership to foster transportation energy choices nationwide.
California has 11 coalitions.
Contact a local coalition or regional manager for project assistance or to connect with other local stakeholders.
Transportation Fuel Consumption
Source: State Energy Data System based on beta data converted to gasoline gallon equivalents of petroleum (GGEs) for the transportation sector (which includes more than highway vehicles) from the U.S. Energy Information Administration
Vehicles Registered in 2024
| Electric (EV) | 1,533,900 |
| Plug-In Hybrid Electric (PHEV) | 447,100 |
| Hybrid Electric (HEV) | 1,895,100 |
| Biodiesel | 217,000 |
| Ethanol/Flex (E85) | 1,309,800 |
| Compressed Natural Gas (CNG) | 10,000 |
| Propane | 1,500 |
| Hydrogen | 16,900 |
| Methanol | 0 |
| Gasoline | 31,251,600 |
| Diesel | 737,900 |
| Unknown Fuel | 7,900 |
Source: Light-duty vehicle registration counts from TransAtlas with data from Experian Information Solutions
Case Studies
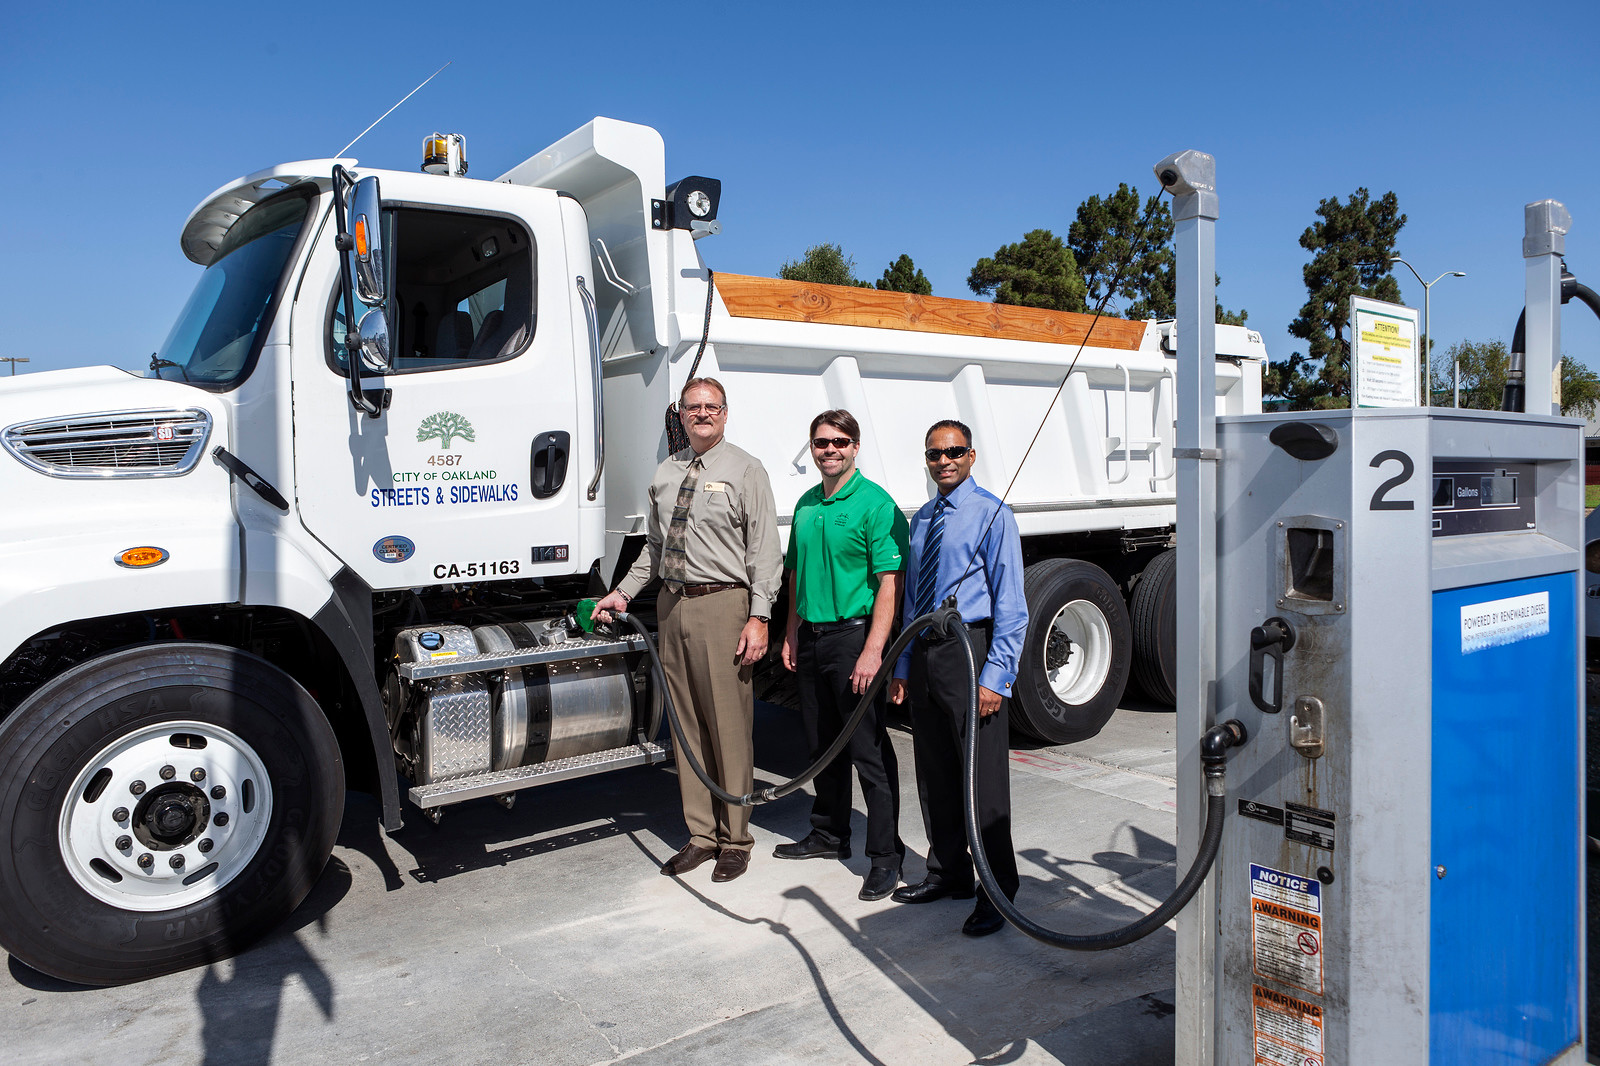
Renewable Diesel in Oakland, California, Demonstrates Cost-Effectiveness of Drop-In-Ready Fuel
Jan. 17, 2025
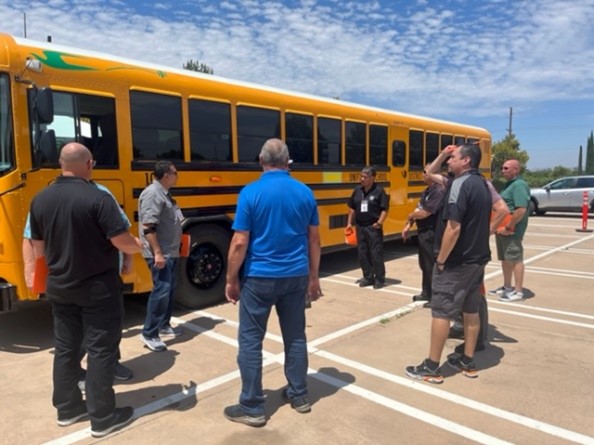
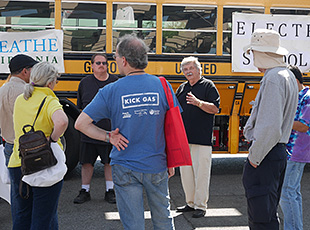
Workforce Training Program Makes Electric School Buses in California More Efficient
Dec. 19, 2024
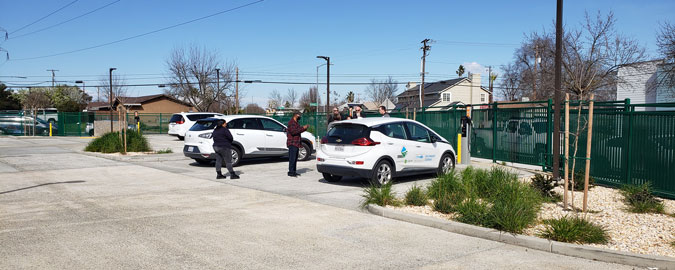
Community Engagement Guides Creation of Neighborhood Microtransit Hub
Aug. 9, 2023
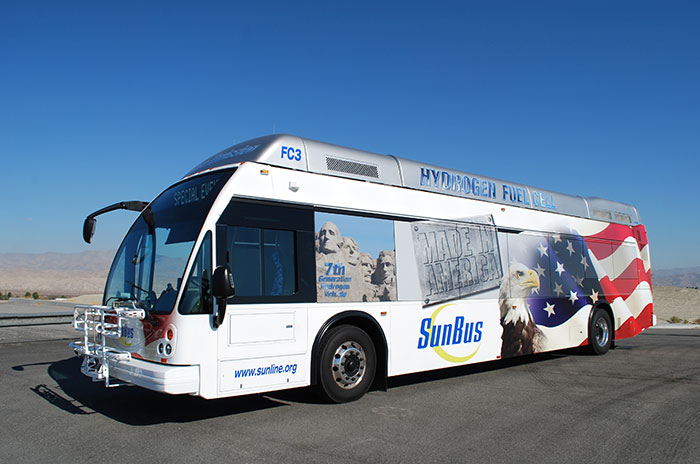
SunLine Transit Demonstrates Excellence in Lower-Pollution Transit
Aug. 27, 2019

Shared Hydrogen Fuel Cell Electric Vehicles Set to Hit the Streets in California
April 17, 2019
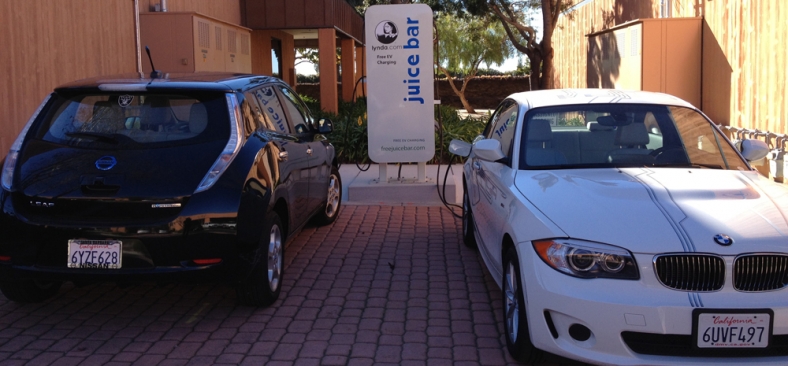
Workplace Charging Success: lynda.com
Jan. 1, 2015
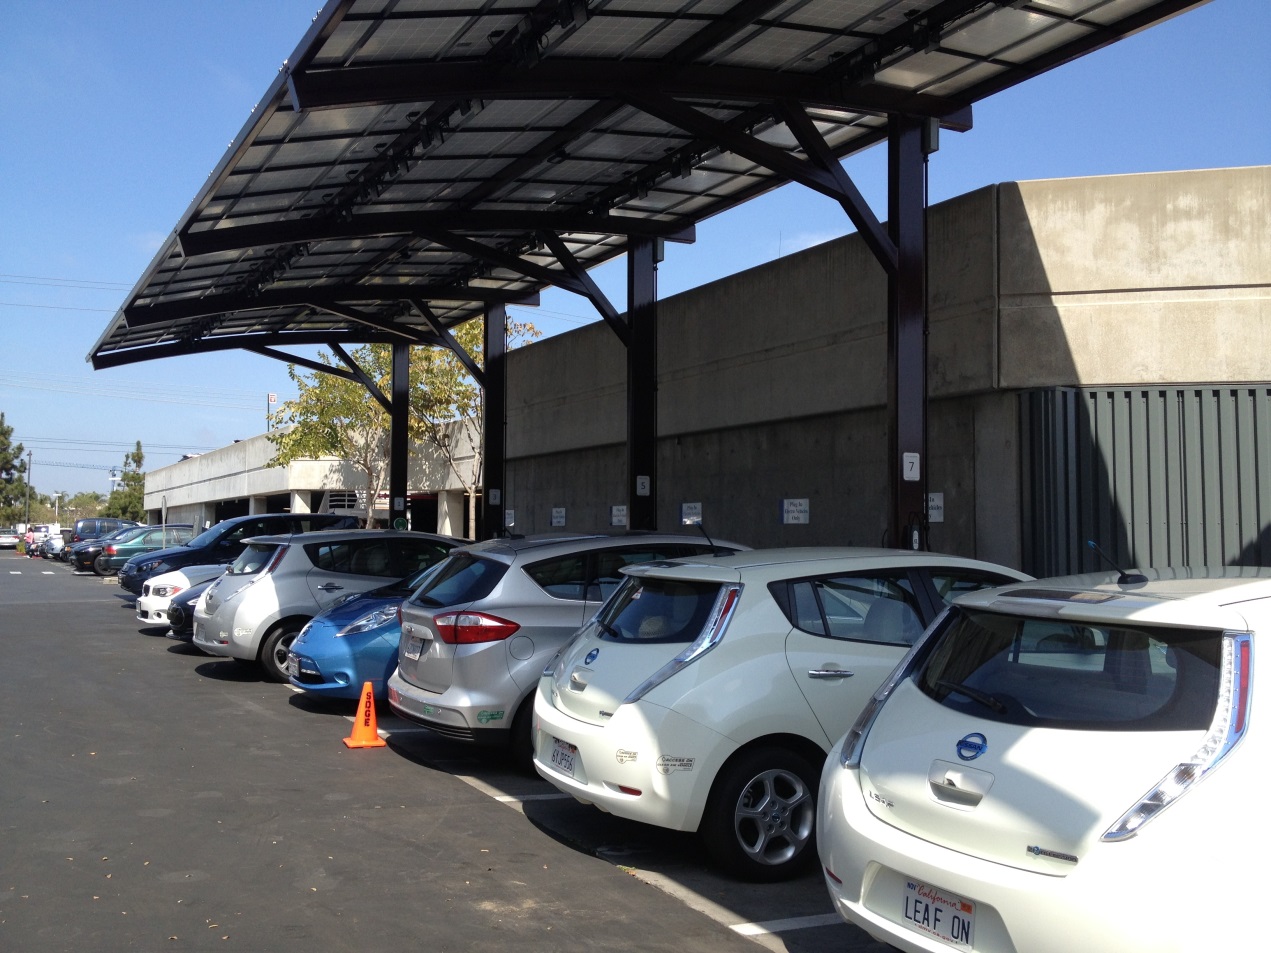
Using Solar Power to Supplement Workplace Charging
Jan. 1, 2015
Silicon Valley-based Electric Vehicle Parade Breaks Guinness World Record
Aug. 19, 2015
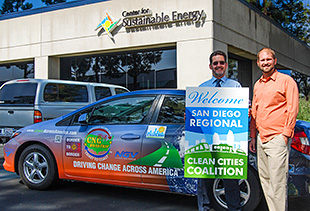
San Diego Dealers Plug-In to Electric Vehicle Progress
Aug. 18, 2015
Liquefied Natural Gas Allows for More Efficient Refuse Collection in Sacramento
July 11, 2018
Ryder Opens Natural Gas Vehicle Maintenance Facility
July 11, 2018
Largest U.S. Port Complex Embraces LNG for Heavy-Duty Trucks
July 1, 2012
California Ramps Up Biofuels Infrastructure in 2016
Oct. 13, 2016
Videos
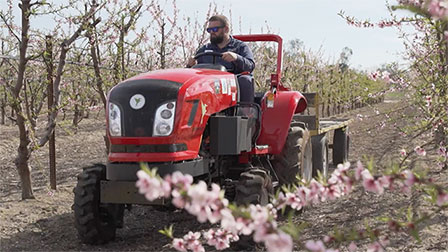
California Farms Increase Efficiency with Electric Tractors
March 24, 2021
Hydrogen Powers Fuel Cell Vehicles in California
Nov. 18, 2017
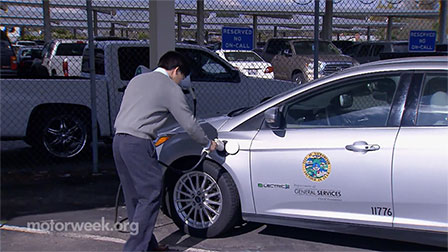
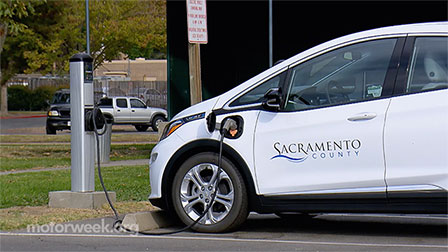
Sacramento Powers up with Electric Vehicles
Oct. 3, 2016
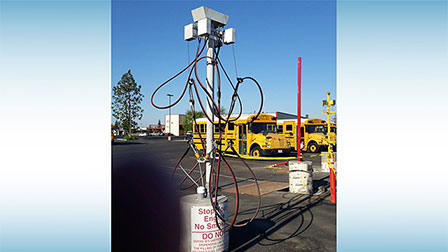
Kern County Schools Expands CNG Station for Bus Fleet and Public Use
Sept. 22, 2015
Los Angeles Public Works Fleet Converts to Natural Gas
May 30, 2015
Sacramento Adds Regional Heavy-Duty LNG Fueling Station
March 21, 2015
California School District Creates First-of-Its-Kind Zero-Emissions Bus
Dec. 20, 2014
UC Davis Pioneers Research for Plug-In Hybrid Electric Vehicles
July 26, 2014
Landfills Convert Biogas Into Renewable Natural Gas
May 25, 2013
Renewable Natural Gas From Landfill Powers Refuse Vehicles
April 13, 2013

San Diego Prepares for Electric Vehicles in Multi-Unit Dwelling Communities
April 5, 2013
Car2Go Launches Electric Carsharing Fleet in San Diego
Feb. 2, 2013
Los Angeles Saves With Hybrid and Plug-In Electric Vehicles
March 31, 2012
San Diego Leads in Promoting EVs
Sept. 3, 2011
Regional Fuel Prices
Average fuel prices as of October 2025
| Fuel | West Coast Region | National Average | ||
|---|---|---|---|---|
| per unit sold | per GGE | per unit sold | per GGE | |
| Biodiesel (B20) | $4.40/gallon | $4.00/GGE | $3.74/gallon | $3.40/GGE |
| Biodiesel (B99–B100) | $4.52/gallon | $4.47/GGE | $4.30/gallon | $4.26/GGE |
| Ethanol (E85) | $3.45/gallon | $4.86/GGE | $2.63/gallon | $3.71/GGE |
| Natural Gas (CNG) | $3.51/GGE | $3.51/GGE | $2.96/GGE | $2.96/GGE |
| Propane | $3.55/gallon | $4.90/GGE | $3.42/gallon | $4.72/GGE |
| Gasoline | $4.43/gallon | $4.43/GGE | $3.14/gallon | $3.14/GGE |
| Diesel | $4.85/gallon | $4.37/GGE | $3.74/gallon | $3.37/GGE |
Source: Average prices per gasoline gallon equivalent (GGE) for the West Coast PADD from the Alternative Fuel Price Report
Transportation Projects
- A Utility-Scale Plan for Accelerating the Deployment of Multi-Family Electric Vehicles Charging Infrastructure
- Accelerating Transportation Decarbonization with Underserved Communities in California's Central Coast and South Bay Regions
- California Fleets and Workplace Alternative Fuels Project
- California Plug-in Electric Vehicle Readiness Project
- Charged by Public Power - Community Voices and Community Choice
- Charging Infrastructure Interconnection Simplification Resource (CIISR)
- Decarbonizing App-Based Deliveries in San Francisco
- Development of a National Liquid Propane (Autogas) Refueling Network, Clean School Bus/Vehicle Incentive, and Green Jobs Outreach Program
- East Coast Commercial Zero-Emissions Vehicle Corridor Planning Partnership
- Electric Vehicle Smart Program Management: Supporting Local Governments to Achieve Equitable Access to Electric Mobility
- Engaging Neighbors About Electric Vehicles in Underserved Places (EVEN-UP)
- Expanding Access to Charging at Home (EACH) Program
- First to Last Mile: Creating an Integrated Goods Movement Charging Network Around the I-710 Corridor
- Golden Gate National Recreation Area
- Heavy-Duty Natural Gas Drayage Truck Replacement Program
- Houston to Los Angeles (H2LA) - Interstate 10 (I-10) Hydrogen Corridor Plan
- Integrated Fuel Cell Electric Powertrain Demonstration
- Integration of Smart Ridesharing into an Existing Electric Vehicle Carsharing Service in the San Joaquin Valley
- Leadership of Employers for Electrification Program (LEEP)
- Low Carbon Fuel Infrastructure Investment Initiative
- Maryland Hybrid Truck Goods Movement Initiative
- Medium- and Heavy-Duty Electric Vehicle Deployment—Data Collection
- Multi-Unit Dwelling Plug-in Electric Vehicle Charging Innovation Pilots in Multiple Metropolitan Areas
- NFPA Spurs the Safe Adoption of Electric Vehicles through Education and Outreach
- No One Silver Bullet, But a Lot of Silver Beebees
- Point Reyes National Seashore
- Safety Training and Design, Permitting, and Operational Guidance for Garage Facilities Maintaining and Parking Natural Gas, Propane, and Hydrogen Vehicles
- San Bernardino Associated Governments Alternative Fuel Truck Project
- San Francisco and Bay Area Regional Medium- and Heavy-Duty Electrification Roadmap
- Smart Compressed Natural Gas (CNG) Station Deployment
- South San Joaquin Valley Zero Emissions Vehicle Talent Pipeline
- The Alternative Fuel Vehicle Curriculum Development and Outreach Initiative
- UPS Ontario—Las Vegas Corridor Extension—Bridging the Gap
- Using a Joint Procurement Process to Increase ZEV Adoption Nationwide
- Utah Clean Cities Transportation Sector Petroleum Reduction Technologies
- VoICE-MR: Vocation Integrated Cost Estimation for Maintenance and Repair of Alternative Fuel Vehicles (AFV)
- WestSmartEV: Western Smart Plug-in Electric Vehicle Community Partnership
Electricity Sources and Vehicle Emissions
Source: Electricity Sources and Emissions Tool based on assumptions with 2024 data from EIA
More Resources
- California Data – U.S. Energy Information Administration
- California State Energy Office
- California Electric Vehicle Charging Plan
- California – National Association of State Energy Officials (NASEO)
- Maps and Data – Alternative Fuels Data Center
- Maps – National Laboratory of the Rockies
- Electric Vehicle Infrastructure Toolbox (EVI-X)
- State Electrification Planning and Funding