Maps and Data
Find maps and charts showing transportation data and trends related to alternative fuels and vehicles.
Or
6 results
-
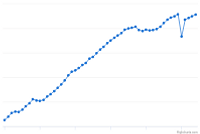
Annual Vehicle Miles Traveled in the United States
Trend of vehicle miles traveled from 1970 to 2025
Last update February 2026 -
Average Fuel Economy by Major Vehicle Category
Comparison of fuel economy among vehicle types
Last update May 2026 -
Average Monthly Fluctuation in U.S. Vehicle Miles Traveled
U.S. vehicle miles traveled for each month of the year, averaged from 2010 to 2026
Last update May 2026 -
Average Vehicle Trip Length by Purpose (2017)
Comparison of average vehicle trip length by purpose in the United States
Last update October 2022 -
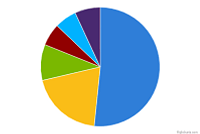
Means of Transportation to Work
Trend of how people commuted to work in the United States from 1980 to 2019
Last update June 2022 -
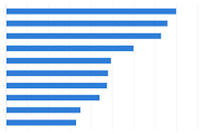
Share of All U.S. Vehicle Trips by Length (miles)
Breakdown of trip lengths among all vehicle trips
Last update January 2026