Maps and Data
Find maps and charts showing transportation data and trends related to alternative fuels and vehicles.
-
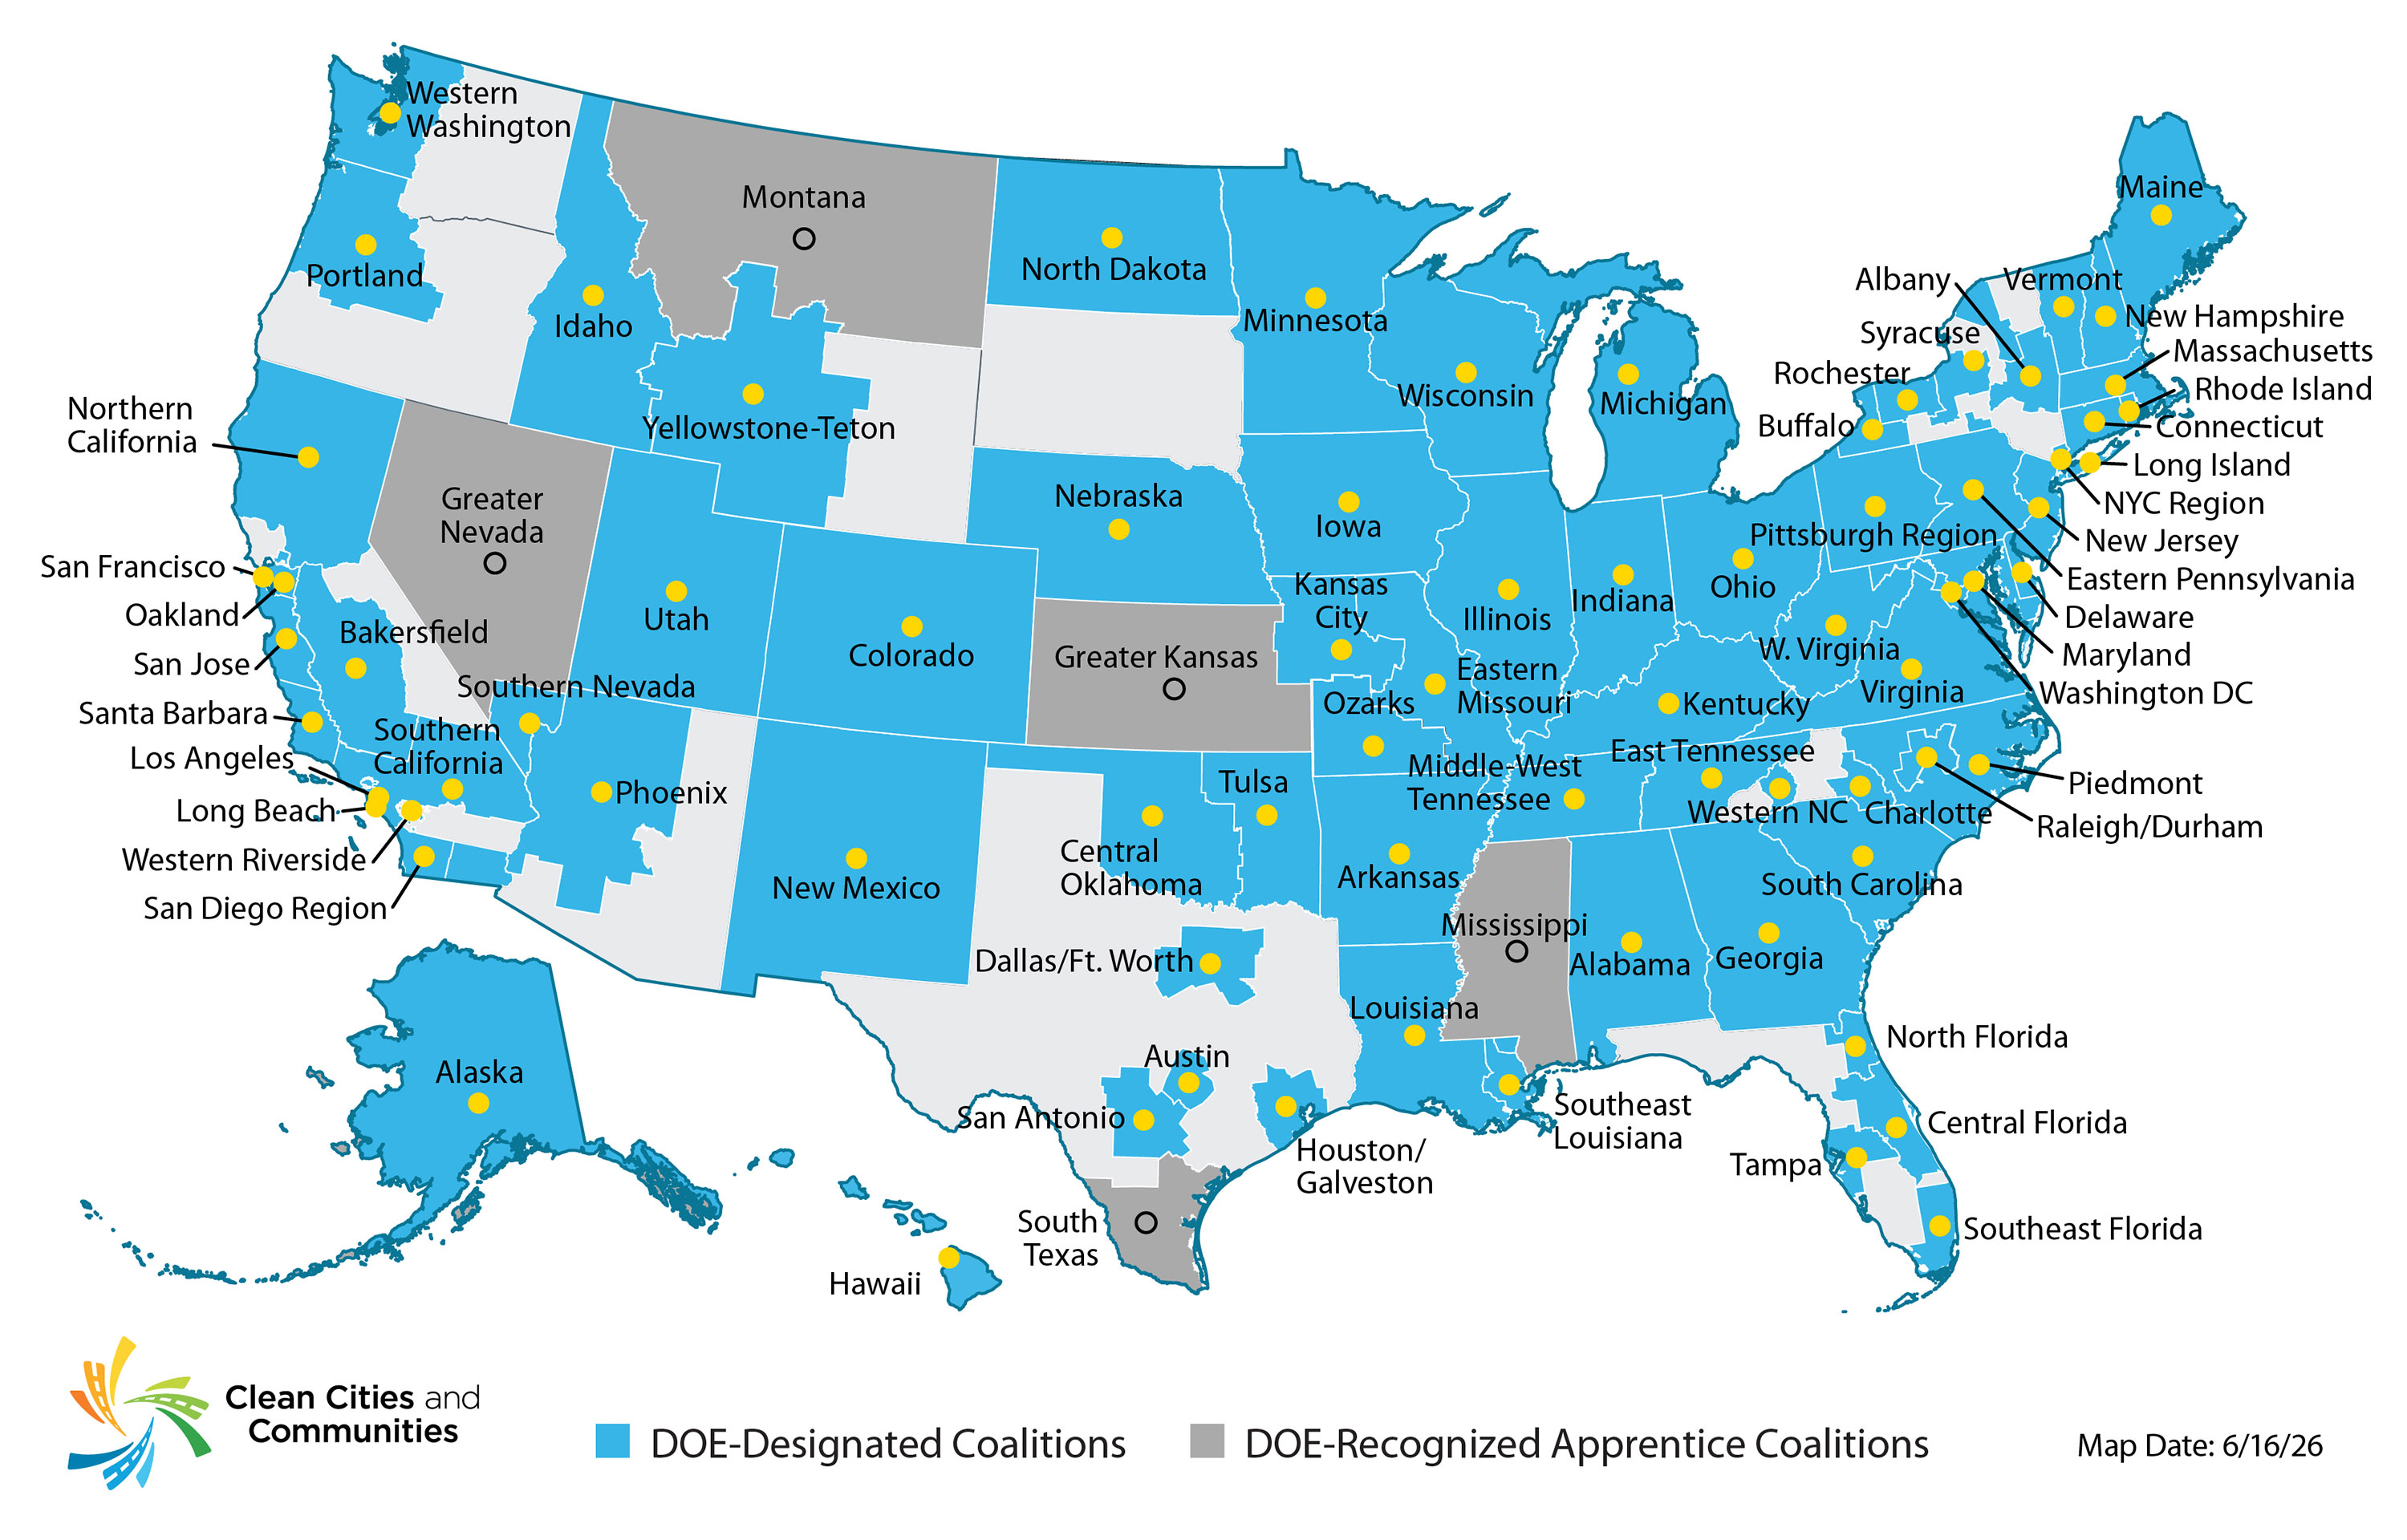
Clean Cities and Communities Coalition Locations
Displays coalition locations and boundaries across the United States
Last update June 2026 -
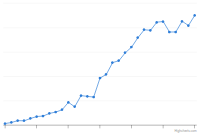
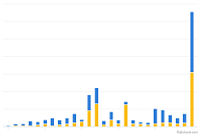
Clean Cities and Communities Project Awards and Matching Funds
Trend of competitive project awards and matching funds from 1998 to 2023
Last update January 2026
-
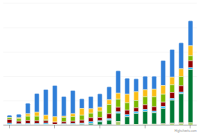
Clean Cities and Communities Alternative Fuel Vehicle Inventory
Alternative fuel vehicle inventory reported by Clean Cities and Communities coalitions from 2004 to 2024
Last update June 2026 -
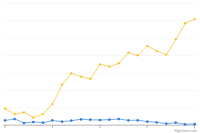
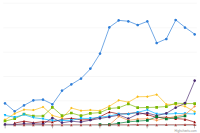
Clean Cities and Communities Energy Use Impact by AFV Type
Trend of energy impact by fuels used in alternative fuel vehicles (AFVs) from 2004 to 2024
Last update June 2026
-
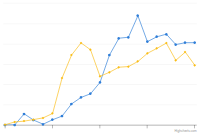
Clean Cities and Communities Annual Energy Use Impact
Trend of reduced fuel use and increased fuel diversity from 1994 to 2024
Last update June 2026 -
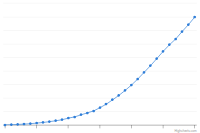
Clean Cities and Communities Cumulative Energy Use Impact
Cumulative trend of reduced fuel use and increased fuel diversity from 1994 to 2024
Last update June 2026 -
Clean Cities and Communities Energy Use Impact by AFV Type
Trend of energy impact by fuels used in alternative fuel vehicles (AFVs) from 2004 to 2024
Last update June 2026 -
Clean Cities and Communities Energy Use Impact by VMT Reduction and FE
Trend of energy impact by fuel economy (FE) improvements and reductions in vehicle miles traveled (VMT) from 2004 to 2024
Last update June 2026 -
Clean Cities and Communities Energy Use Impact through Idle Reduction
Trend of energy impact by idle reduction policies and technologies from 2004 to 2024
Last update June 2026