Maps and Data
Find maps and charts showing transportation data and trends related to alternative fuels and vehicles.
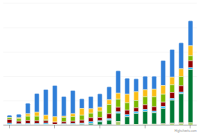
Alternative fuel vehicle inventory reported by Clean Cities and Communities coalitions from 2004 to 2024
Last update June 2026
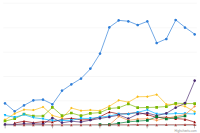
Trend of energy impact by fuels used in alternative fuel vehicles (AFVs) from 2004 to 2024
Last update June 2026
Clean Cities and Communities Alternative Fuel Vehicle Inventory
2004
2005
2006
2007
2008
2009
2010
2011
2012
2013
2014
2015
2016
2017
2018
2019
2020
2021
2022
2023
2024
E85
47.643
72.899
221.834
385.671
524.169
642.52
403.981
479.706
197.187
259.337
275.508
271.996
457.817
327.865
263.967
275
268
516.313
568.837
534.976
511.781
HEVs
10.674
18.553
43.886
81.987
101.954
107.585
30.613
50.503
141.406
83.339
82.834
94.33
129.827
178.011
178.733
145
158
177.9
154.089
157.582
207.358
Biodiesel
31.922
52.275
91.584
98.785
17.222
2.814
88.726
99.347
103.106
98.028
130.54
189.823
160.763
150.695
153.38
163
204
163.116
155.978
191.454
98.855
CNG
76.257
49.271
57.458
55.021
51.121
44.317
42.911
48.157
59.521
79.616
68.479
107.283
98.388
97.271
82.266
101
87
93.153
123.463
129.026
143.905
Propane
31.338
21.117
25.543
23.628
22.26
7.937
13.196
18.793
16.501
35.554
17.404
22.762
23.648
34.753
25.395
32
30
31.982
33.716
33.909
33.763
LNG
0
1.873
2.271
1.731
2.053
2.038
3.41
4.315
3.411
3.645
2.992
3.974
4.924
5.07
5.1
5
5
3.969
2.86
2.673
2.667
Hydrogen
0.023
0.042
0.072
0.086
0.075
0.074
0.062
0.118
0.05
0.046
0.049
0.094
0.097
0.116
0.402
1
0
0.371
0.276
0.429
0.435
PEVs
9.241
7.464
9.481
5.895
14.135
4.568
9.223
10.541
20.455
32.187
65.042
96.896
171.011
162.811
227.854
264
234
314.936
475.33
595.912
1095.753
RNG
0
0
0
0
0
0
0
0
0
0
0.313
0.366
1.157
1.734
1.677
5
7
11.043
11.002
13.185
Renewable Diesel
0
0
0
0
0
0
0
0
0
0
0
3.183
71.066
7.819
11.174
13
12
19.089
27.377
33.597
47.756
Clean Cities and Communities have made great strides to integrate alternative fuel vehicles (AFVs) across the United States. In 2024, more than 2.1 million of the AFVs in operation were a result of Clean Cities and Communities efforts.
Clean Cities and Communities have made great strides to integrate alternative fuel vehicles (AFVs) across the United States. In 2024, more than 2.1 million of the AFVs in operation were a result of Clean Cities and Communities efforts.