Maps and Data
Find maps and charts showing transportation data and trends related to alternative fuels and vehicles.
-
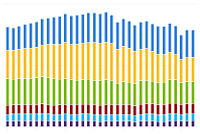
Greenhouse Gas Emissions by Economic Sector
Trend of U.S. greenhouse gas emission for each economic sector
Last update May 2024
Greenhouse Gas Emissions by Economic Sector
| 1990 | 1991 | 1992 | 1993 | 1994 | 1995 | 1996 | 1997 | 1998 | 1999 | 2000 | 2001 | 2002 | 2003 | 2004 | 2005 | 2006 | 2007 | 2008 | 2009 | 2010 | 2011 | 2012 | 2013 | 2014 | 2015 | 2016 | 2017 | 2018 | 2019 | 2020 | 2021 | 2022 | |
| Transportation | 1521.42012267999 | 1474.7714546 | 1533.76416208 | 1570.22062396 | 1624.5456349 | 1659.11585649 | 1714.58813188 | 1740.49518401 | 1782.6700027 | 1853.61742775999 | 1903.74070092 | 1875.43638622 | 1916.20430154 | 1923.65744009 | 1956.16410704 | 1965.91586602 | 1966.341904581 | 1967.18977856 | 1863.443299783 | 1789.02260166999 | 1795.14854142999 | 1762.377423323 | 1743.520088376 | 1746.765248104 | 1780.99189058 | 1789.41320131999 | 1824.49284538 | 1841.924004528 | 1871.607869172 | 1874.554777024 | 1625.283475796 | 1805.471920947 | 1801.520908929 |
| Electricity Generation | 1880.175679651 | 1874.408851683 | 1889.635530017 | 1964.989427695 | 1989.595913078 | 2006.048306961 | 2078.436657977 | 2143.760122335 | 2230.087829143 | 2243.485009235 | 2350.064438638 | 2310.779764306 | 2326.468180206 | 2357.9677204 | 2391.13397500699 | 2457.44715722 | 2402.371272511 | 2468.3236678 | 2415.236378544 | 2198.658511328 | 2313.100970174 | 2210.21518420699 | 2072.657471583 | 2090.987727989 | 2091.043603873 | 1951.696058549 | 1859.330637976 | 1779.357830753 | 1799.179777529 | 1650.752461545 | 1482.168360396 | 1584.447572912 | 1577.493447487 |
| Industry | 1723.32232051599 | 1702.866693002 | 1729.275077694 | 1701.00002975499 | 1719.67162523 | 1741.76586794799 | 1762.112970515 | 1765.41271217999 | 1757.760768545 | 1703.937152222 | 1699.09353195599 | 1631.35399358199 | 1613.804270986 | 1593.643666286 | 1639.829197988 | 1587.259170193 | 1624.488722683 | 1611.628147355 | 1571.709220815 | 1415.50493638999 | 1488.56982432 | 1488.393280254 | 1473.15884950299 | 1533.828318091 | 1526.87994389699 | 1506.061400488 | 1456.232277636 | 1478.412290793 | 1541.869214308 | 1531.79754036099 | 1435.91076223 | 1455.79558867 | 1452.536165637 |
| Agriculture | 595.946054315 | 587.411997223 | 587.511140474 | 608.733193037 | 612.158537688999 | 618.123911632 | 625.693882927 | 610.728829758 | 621.023100021 | 614.986760919 | 607.226572447999 | 622.405679947 | 628.402932182999 | 627.684215457 | 633.535446477999 | 634.30323706 | 638.728891262 | 654.903372179 | 643.038956138 | 639.829853682 | 647.14231974 | 641.226365647 | 624.385259100999 | 658.485863718999 | 660.868013748 | 657.35266314 | 650.363697821 | 658.503898907999 | 683.533938742999 | 661.035226966999 | 640.048676085999 | 645.876462264 | 633.964508752999 |
| Commercial | 447.006292302 | 454.452721041 | 449.970155317 | 443.082240078 | 446.051459479 | 444.491719275 | 451.625772874 | 442.880099174999 | 416.338725309 | 411.817873743 | 425.633761278 | 414.052081335 | 415.310840777 | 431.720081145 | 429.132622803 | 418.863933029 | 404.901416866999 | 418.42506357 | 425.324512365 | 428.256573988 | 430.587609504 | 425.528968397 | 406.456125406 | 429.200746854 | 439.358052479 | 451.674786147 | 435.630707027 | 437.389191342 | 453.481028816 | 462.630952229999 | 436.915126499 | 443.663062661 | 463.661568603 |
| Residential | 345.597114742999 | 355.264350438 | 361.808133412 | 373.147537632 | 363.773427651 | 367.292044541 | 399.137914666 | 380.425938134999 | 346.522958163 | 366.325388201999 | 387.642128584 | 377.790426275 | 375.113216312 | 393.678825878 | 381.913393628 | 371.189484271999 | 334.363825679 | 355.266742602 | 363.827773198 | 353.866061154 | 355.005227399 | 348.859719349 | 306.48007232 | 357.202065785 | 377.61824479 | 350.689959957 | 327.026529269999 | 329.161535636 | 376.819522916 | 384.210676539 | 358.042212399 | 369.609905452 | 391.301657308 |
Source: Environmental Protection Agency U.S. Greenhouse Gas Inventory Data Explorer.
Notes: Emissions values are presented in million metric tons carbon dioxide equivalent (MMT CO2 eq.) using Fourth Assessment Report (AR4) global warming potential (GWP) values established by the Intergovernmental Panel on Climate Change (IPCC).
To view more details, notes, and acronyms, please download the Excel spreadsheet.