Maps and Data
Find maps and charts showing transportation data and trends related to alternative fuels and vehicles.
Or
-
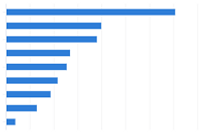
Average Per-Passenger Fuel Economy by Travel Mode
Comparison of per-passenger fuel economy for various modes of transportation
Last update October 2022 -
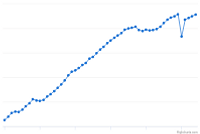
Annual Vehicle Miles Traveled in the United States
Trend of vehicle miles traveled from 1970 to 2025
Last update February 2026 -
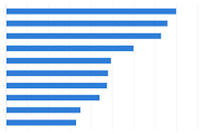
Average Annual Fuel Use by Vehicle Type
Comparison of fuel use (per vehicle) among vehicle types
Last update December 2025 -
Average Vehicle Trip Length by Purpose (2017)
Comparison of average vehicle trip length by purpose in the United States
Last update October 2022 -
Clean Cities and Communities Coalition Locations
Displays coalition locations and boundaries across the United States
Last update March 2026