Maps and Data
Find maps and charts showing transportation data and trends related to alternative fuels and vehicles.
-
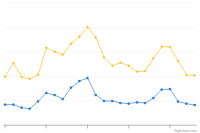
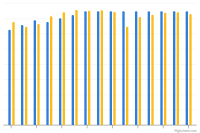
U.S. Soybean and Corn Prices
Trend of soybean and corn prices, adjusted for inflation, from 2002 to 2025
Last update June 2026 -
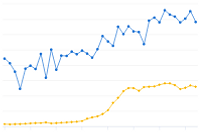
U.S. Corn Production and Portion Used for Fuel Ethanol
Trend of corn produced in the United States and quantity used for ethanol from 1986 to 2023
Last update January 2024 -
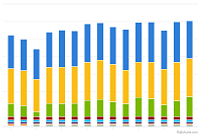
U.S. Corn Use by Market Year
Annual usage of the U.S. corn crop according to end product or destination
Last update January 2026 -
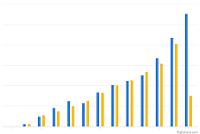
RFS2 Mandates and Net RINs Generated for Cellulosic Biofuels
Displays yearly Renewable Fuel Standard (RFS) mandates from Environmental Protection Agency (EPA) volume requirements, and net Renewable Identification Numbers (RINs) generated
Last update February 2026 -
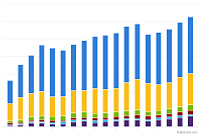
Global Ethanol Production by Country or Region
Quantity of ethanol produced by country/region from 2007 to 2024
Last update January 2026 -
Renewable Fuel RFS2 Mandates and Net RINs Generated
Displays yearly Renewable Fuel Standard (RFS) mandates from Environmental Protection Agency (EPA) volume requirements, and net Renewable Identification Numbers (RINs) generated
Last update May 2026