Maps and Data
Find maps and charts showing transportation data and trends related to alternative fuels and vehicles.
-
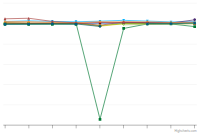
Change in U.S. Light-Duty Vehicle Registration Counts
Trend of light-duty vehicle registrations by fuel type, measured in percent change from 2016 through 2025
Last update June 2026 -
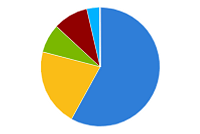
Light-Duty AFV Registrations
Breakdown of alternative fuel vehicle (AFV) registrations by fuel type
Last update June 2024 -
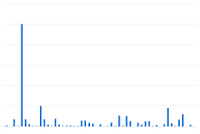
Electric Vehicle Registrations by State
U.S. light-duty electric vehicle population as of December 2023
Last update September 2024 -

TransAtlas
Interactive map displays light-duty vehicle registration counts over time by state and fuel type
Change in U.S. Light-Duty Vehicle Registration Counts
| 2016-2017 | 2017-2018 | 2018-2019 | 2019-2020 | 2020-2021 | 2021-2022 | 2022-2023 | 2023-2024 | 2024-2025 | |
| Gasoline | 1.12595568379844 | 0.723957880877847 | 0.987513766496023 | 0.273026420715869 | 3.61749816680134 | 0.278987409108479 | 0.616788590152217 | 0.184776868369085 | 1.29755079697399 |
| Ethanol/Flex (E85) | 10.0350703235166 | 6.39331416137916 | 4.54708849085172 | 1.63052019487663 | -31.7831573695334 | -1.61766323714407 | -3.29091034850746 | -1.64617733317263 | -1.02328129835473 |
| Diesel | 4.70440375563715 | 1.98072417208145 | 3.17042650481236 | 3.4941594718131 | -24.6149951478841 | 0.651119898279982 | 0.381387191514831 | -0.137990633363069 | 0.347209634362433 |
| Hybrid Electric (HEV) | 7.29435084241824 | 4.86517065811805 | 5.99392851603182 | 6.24883146020732 | 12.3474999089552 | 12.7149623319241 | 14.8871122654654 | 13.0583586197163 | 18.2363688816232 |
| Electric (EV) | 25.6695836648104 | 34.1425078588893 | 26.9270035732517 | 23.0935322406517 | 29.9436193619362 | 40.4495762191377 | 31.3169661689024 | 21.044918622466 | 20.964147201797 |
| Biodiesel | 13.1427892799177 | 9.89798830075617 | 7.49026595393651 | 46.8166502878001 | |||||
| Plug-In Hybrid Electric (PHEV) | 26.2913522925131 | 25.2980706698461 | 14.0327991054789 | 9.72409152086137 | 24.4534824605999 | 22.2836823389964 | 22.5520195838433 | 14.0452393477117 | 14.1373080397471 |
| Compressed Natural Gas (CNG) | -8.82219876338411 | -8.84766907419567 | -8.64990190832887 | -7.49616564417178 | -1178.43137254902 | -59.375 | -3.64372469635627 | -4.21940928270042 | -36.9942196531792 |
| Hydrogen | 59.375 | 65.9574468085106 | 26.5625 | 9.85915492957746 | -20.3389830508475 | 20.8053691275168 | 11.8343195266272 | 0.588235294117647 | |
| Propane | -15.1515151515152 | -10 | -5.26315789473684 | 3.38983050847458 | |||||
| Unknown Fuel | -7.55609721126962 | -4.54170726223488 | -2.57533825338253 | -4.64162175207143 | -35.1048799043582 | -3.46496664895815 | -1.77831180534695 | 7.80656049512502 |
Source: Vehicle registration counts derived by the National Laboratory of the Rockies with data from Experian Information Solutions
Notes: Data represent registered vehicles in operation in the United States in the given years.
Data is subject to changes in reporting methods and definitions through the years.
For more detailed vehicle registration counts, visit the AFDC Vehicle Registration Counts website (https://afdc.energy.gov/vehicle-registration) The distinction between "Diesel" and "Biodiesel" vehicle registrations in this dataset is derived from original equipment manufacturer (OEM) VIN-decoding, which typically flags vehicles specifically marketed with B20 capability. However, virtually all diesel vehicles on the U.S. road today are approved by OEMs to operate on at least a B5 biodiesel blend (5% biodiesel), and a significant majority of modern diesel engines are fully warranted for B20 (20% biodiesel). Therefore, the specific "Biodiesel" registration count underestimates the true physical capability of the U.S. diesel fleet to utilize biodiesel fuels.
To view more details, notes, and acronyms, please download the Excel spreadsheet.