
Maps and Data
Find maps and charts showing transportation data and trends related to alternative fuels and vehicles.
Or
-
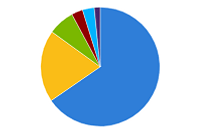
Fuel Use by Transportation Mode in 2019
Breakdown of fuel used in the United States by transportation mode, 2019
Last update May 2023
Fuel Use by Transportation Mode in 2019
Source: Oak Ridge National Laboratory, Transportation Energy Data Book #40, Table 2.8
This chart shows the fuel used for domestic transportation in the United States. The largest amount is used in the form of gasoline by light-duty vehicles. The second largest portion is used in the form of diesel fuel in medium- and heavy-duty vehicles. Air travel consumes 7% of transportation petroleum, primarily in the form of jet fuel. Water and rail travel together consume 5% in the form of diesel fuel and some gasoline and electricity. Finally, pipelines consume 3% of transportation fuel, mostly in the form of natural gas.
To view more details, notes, and acronyms, please download the Excel spreadsheet.
Source: Oak Ridge National Laboratory, Transportation Energy Data Book #40, Table 2.8
This chart shows the fuel used for domestic transportation in the United States. The largest amount is used in the form of gasoline by light-duty vehicles. The second largest portion is used in the form of diesel fuel in medium- and heavy-duty vehicles. Air travel consumes 7% of transportation petroleum, primarily in the form of jet fuel. Water and rail travel together consume 5% in the form of diesel fuel and some gasoline and electricity. Finally, pipelines consume 3% of transportation fuel, mostly in the form of natural gas.
To view more details, notes, and acronyms, please download the Excel spreadsheet.