Maps and Data
Find maps and charts showing transportation data and trends related to alternative fuels and vehicles.
OR
-
-
Global Ethanol Production by Country or Region
Quantity of ethanol produced by country/region from 2007 to 2022 Last update January 2024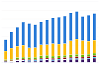
-
-
-
U.S. Ethanol Plants, Capacity, and Production
Trend of ethanol plant counts and production volumes from 1999 to 2022 Last update April 2024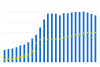
-
-
-
U.S. Production, Consumption, and Trade of Ethanol
Trend of total ethanol fuel production and consumption from 2000 to 2023 Last update October 2024
-
-
-
U.S. Corn Production and Portion Used for Fuel Ethanol
Trend of corn produced in the United States and quantity used for ethanol from 1986 to 2023 Last update January 2024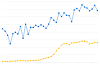
-
-
-
U.S. Corn Use by Market Year
Annual usage of the U.S. corn crop according to end product or destination Last update January 2024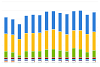
-
-
-
Renewable Fuel RFS2 Mandates and Net RINs Generated
Displays yearly Renewable Fuel Standard (RFS) mandates from Environmental Protection Agency (EPA) volume requirements, and net Renewable Identification Numbers (RINs) generated Last update April 2024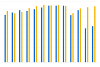
-
-
-
RFS2 Mandates and Net RINs Generated for Cellulosic Biofuels
Displays yearly Renewable Fuel Standard (RFS) mandates from Environmental Protection Agency (EPA) volume requirements, and net Renewable Identification Numbers (RINs) generated Last update April 2024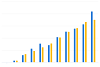
-
-
-
Total Advanced Biofuel RFS2 Mandates and Net RINs Generated
Displays yearly Renewable Fuel Standard (RFS) mandates from Environmental Protection Agency (EPA) volume requirements, and net Renewable Identification Numbers (RINs) generated Last update April 2024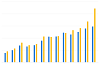
-
-
-
Total RFS2 Mandates and Net RINs Generated
Displays yearly Renewable Fuel Standard (RFS) mandates from Environmental Protection Agency (EPA) volume requirements, and net Renewable Identification Numbers (RINs) generated Last update April 2024
-
-
-
Average Retail Fuel Prices in the United States
Trend of alternative and traditional motor fuel prices from 2000 to 2025 Last update April 2025
-
-
-
U.S. Soybean and Corn Prices
Trend of soybean and corn prices, adjusted for inflation, from 2002 to 2023 Last update May 2024
-
-
-
U.S. Public and Private Alternative Fueling Stations by Fuel Type
Trend of alternative fueling station counts by fuel type in the United States from 1992 to 2023 Last update May 2024
-
-
-
Clean Cities and Communities Energy Use Impact by AFV Type
Trend of energy impact by fuels used in alternative fuel vehicles (AFVs) from 2004 to 2022 Last update February 2024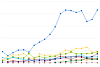
-
-
-
AFV and HEV Model Offerings, by Manufacturer
Trend of alternative fuel vehicle (AFV) and hybrid electric vehicle (HEV) models by manufacturer, 1991-2024 Last update October 2024
-

Global Ethanol Production by Country or Region
| 2007 | 2008 | 2009 | 2010 | 2011 | 2012 | 2013 | 2014 | 2015 | 2016 | 2017 | 2018 | 2019 | 2020 | 2021 | 2022 | |
| USA | 6.521 | 9.309 | 10.938 | 13.298 | 13.948 | 13.3 | 13.3 | 14.313 | 14.807 | 15.413 | 15.936 | 16.091 | 15.778 | 13.941 | 15.015 | 15.361 |
| Brazil | 5.0192 | 6.472 | 6.578 | 6.921 | 5.573 | 5.577 | 6.267 | 6.19 | 7.093 | 6.84 | 6.73 | 8.06 | 8.86 | 8.1 | 7.43 | 7.4 |
| European Union | 0.57 | 0.734 | 1.04 | 1.209 | 1.16764 | 1.179 | 1.371 | 1.445 | 1.387 | 1.19 | 1.25 | 1.3 | 1.35 | 1.28 | 1.35 | 1.46 |
| China | 0.486 | 0.5019 | 0.542 | 0.54155 | 0.55476 | 0.555 | 0.696 | 0.635 | 0.813 | 0.73 | 0.85 | 0.81 | 1.01 | 0.93 | 0.86 | 0.92 |
| Canada | 0.2113 | 0.2377 | 0.291 | 0.35663 | 0.4623 | 0.449 | 0.523 | 0.51 | 0.436 | 0.46 | 0.46 | 0.46 | 0.497 | 0.429 | 0.434 | 0.447 |
| Rest of World | 0.3153 | 0.3894 | 0.914 | 0.98461 | 0.69815 | 0.752 | 1.272 | 1.49 | 1.147 | 1.417 | 1.544 | 1.819 | 1.835 | 1.79 | 2.181 | 2.632 |
Source: Renewable Fuels Association
This chart shows global ethanol production by country or region, from 2007 to 2022. Overall, global production increased over time, but production fell worldwide in 2020 because of the COVID-19 pandemic. While subsequently increasing, production has not reached pre-pandemic levels. The United States is the world's largest producer of ethanol, having produced over 15 billion gallons in 2021 and 2022. Together, the United States and Brazil produce 80% of the world's ethanol. The vast majority of U.S. ethanol is produced from corn, while Brazil primarily uses sugarcane.
To view more details, notes, and acronyms, please download the Excel spreadsheet.
Print