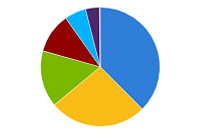
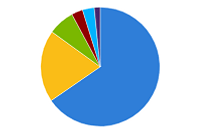
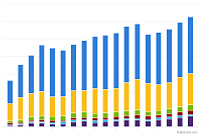
Maps and Data - U.S. Public and Private Alternative Fueling Stations by Fuel Type
Find maps and charts showing transportation data and trends related to alternative fuels and vehicles.
-
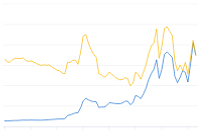
Average Annual Retail Fuel Price of Gasoline
Trend of gasoline prices, actual and inflation-adjusted, from 1950 to 2023
Last update January 2024 -
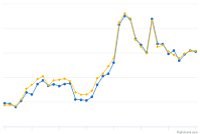
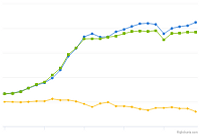
Average Renewable Diesel and Diesel Fuel Prices in California
Trend of renewable diesel and diesel motor fuel prices in California from 2017 to 2025
Last update February 2026 -
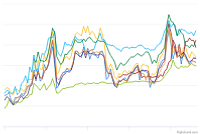
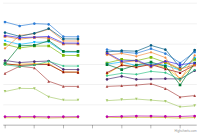
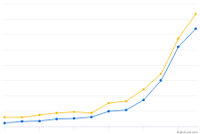
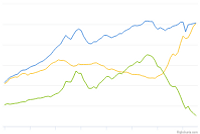
Average Retail Fuel Prices in the United States
Trend of alternative and traditional motor fuel prices from 2000 to 2025
Last update January 2026 -
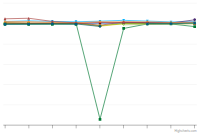
Change in U.S. Light-Duty Vehicle Registration Counts
Trend of light-duty vehicle registrations by fuel type, measured in percent change from 2016 through 2025
Last update June 2026 -
Consumption of Natural Gas in the United States
U.S. natural gas consumption by end use in 2022
Last update January 2024 -
Energy Use by Transportation Mode and Fuel Type
Amount of energy consumed through different transportation modes, 2019
Last update May 2023 -
Fuel Taxes by Country
Comparison of gasoline and diesel taxes in eight nations from 2010-2023
Last update June 2026 -
Fuel Use by Transportation Mode in 2019
Breakdown of fuel used in the United States by transportation mode, 2019
Last update May 2023 -
Global Ethanol Production by Country or Region
Quantity of ethanol produced by country/region from 2007 to 2024
Last update January 2026 -
Renewable Diesel Production and Consumption
Renewable diesel domestic production and consumption from 2013 to 2024
Last update February 2026 -
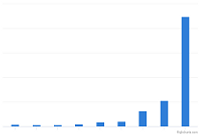
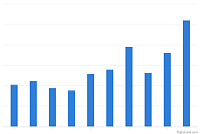
Sustainable Aviation Fuel Estimated Consumption
Estimated U.S. consumption of sustainable aviation fuel from 2016 to 2024
Last update February 2026 -
U.S. Biodiesel Production, Exports, and Consumption
Trend of biodiesel production, exports, and consumption from 2001 to 2025
Last update May 2026 -
U.S. Crude Oil Imports by Country of Origin
Quantity of oil imports by country of production, from 1973 to 2024
Last update February 2026 -
U.S. Production, Consumption, and Trade of Ethanol
Trend of total ethanol fuel production and consumption from 2000 to 2024
Last update January 2026 -
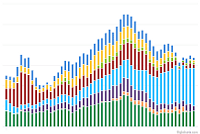
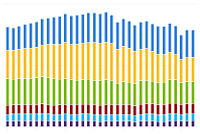
U.S. Production, Consumption, and Trade of Petroleum Products
Trend of total petroleum product production, consumption, and trade from 1949 to 2024
Last update January 2026 -
U.S. Renewable Diesel Imports
Renewable diesel fuel imports to the United States from 2015 to 2024
Last update February 2026

-
Greenhouse Gas Emissions by Economic Sector
Trend of U.S. greenhouse gas emission for each economic sector
Last update May 2024
-
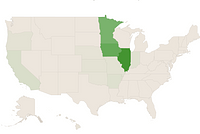
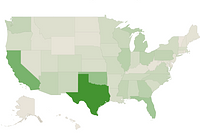
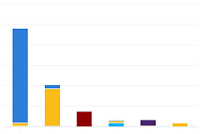
Biodiesel Fueling Station Locations by State
Displays states and their respective biodiesel station counts
-
Compressed Natural Gas Fueling Stations by State
Displays states and their respective compressed natural gas (CNG) station counts
-
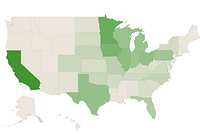
E85 Fueling Station Locations by State
Displays states and their respective E85 station counts
-
Electric Vehicle Charging Ports by State
Displays states and their respective EV charging port counts
-
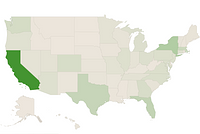
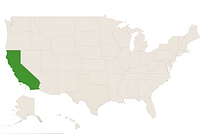
Hydrogen Fueling Station Locations by State
Displays states and their respective hydrogen station counts
-
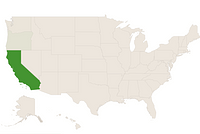
Liquefied Natural Gas Fueling Stations by State
Displays states and their respective liquefied natural gas (LNG) station counts
-
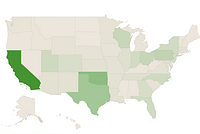
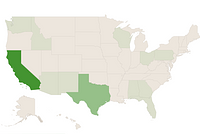
Propane Fueling Station Locations by State
Displays states and their respective propane station counts
-
Renewable Diesel Fueling Station Locations by State
Displays states and their respective renewable diesel station counts