Maps and Data - Average Annual Retail Fuel Price of Gasoline
Find maps and charts showing transportation data and trends related to alternative fuels and vehicles.
-
Clean Cities and Communities Energy Use Impact through Idle Reduction
Trend of energy impact by idle reduction policies and technologies from 2004 to 2023
Last update January 2026
-
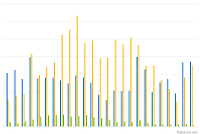
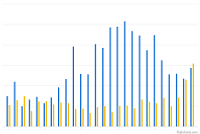
AFV Acquisitions by Regulated Fleets (by Fleet Type)
Trend of State & Alternative Fuel Provider (S&FP) alternative fuel vehicle (AFV) acquisitions by fleet type from 1992 to 2024
Last update February 2026 -
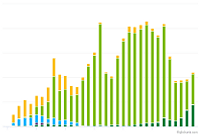
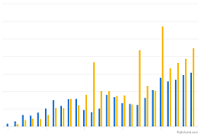
AFV Acquisitions by Regulated Fleets (by Fuel Type)
Trend of State & Alternative Fuel Provider (S&FP) alternative fuel vehicle (AFV) acquisitions by fuel type from 1992 to 2024
Last update February 2026 -
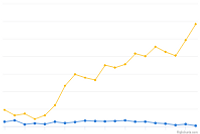
Annual Vehicle Credits Earned and Used by Regulated Fleets
Trend of State & Alternative Fuel Provider (S&FP) EPAct credits traded and transactions from 1999 to 2024
Last update February 2026 -
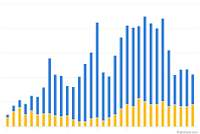
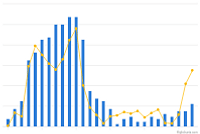
Biodiesel Purchases by EPAct-Regulated Fleets
Trend of State and Alternative Fuel Provider Biodiesel Purchases from 2000 to 2024
Last update February 2026 -
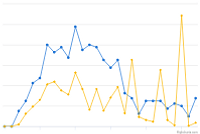
EPAct State & Alternative Fuel Provider Fleet Exemptions
Trend of State & Alternative Fuel Provider (S&FP) exemption requests and vehicles exempted from 1997 to 2024
Last update February 2026 -
Vehicle Credits Traded by Regulated Fleets
Trend of State & Alternative Fuel Provider (S&FP) EPAct credits traded and transactions from 1997 to 2024
Last update February 2026
-
AFV Requirements, Acquisitions, and Credits for Federal Agencies
Displays EPAct alternative fuel vehicle (AFV) acquisition requirements, total AFV acquisitions, and additional credits toward the acquisition requirements for federal agencies from fiscal years 2000 through 2024
Last update February 2026