Maps and Data
Find maps and charts showing transportation data and trends related to alternative fuels and vehicles.
-
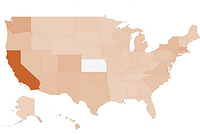
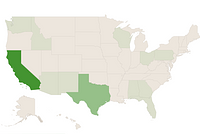
Hydrogen Fueling Station Locations by State
Displays states and their respective hydrogen station counts
-
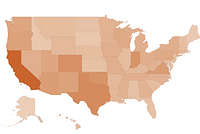
Hydrogen Laws and Incentives by State
Displays states and their respective law and incentive counts related to the use of hydrogen
-
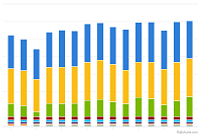
Law and Incentive Additions by Fuel/Technology Type
Trend of state law and incentive enactments, listed by the targeted technology or fuel type, from 2002 to 2024
Last update February 2026 -
TransAtlas
Interactive map displays light-duty vehicle registration counts over time by state and fuel type


-
Law and Incentive Additions by Fuel/Technology Type
Trend of state law and incentive enactments, listed by the targeted technology or fuel type, from 2002 to 2024
Last update February 2026 -
Light-Duty AFV, HEV, and Diesel Model Offerings, by Technology/Fuel
Trend of vehicle models incorporating various advanced technologies or alternative fuels, from 1991 through 2025
Last update March 2026 -
TransAtlas
Interactive map displays light-duty vehicle registration counts over time by state and fuel type
-
U.S. Corn Use by Market Year
Annual usage of the U.S. corn crop according to end product or destination
Last update January 2026

-
Law and Incentive Additions by Fuel/Technology Type
Trend of state law and incentive enactments, listed by the targeted technology or fuel type, from 2002 to 2024
Last update February 2026 -
Light-Duty AFV, HEV, and Diesel Model Offerings, by Technology/Fuel
Trend of vehicle models incorporating various advanced technologies or alternative fuels, from 1991 through 2025
Last update March 2026 -
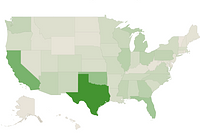
Liquefied Natural Gas Fueling Stations by State
Displays states and their respective liquefied natural gas (LNG) station counts
-
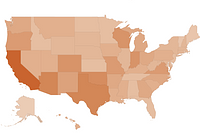
Natural Gas Laws and Incentives by State
Displays states and their respective law and incentive counts related to the use of natural gas
-
TransAtlas
Interactive map displays light-duty vehicle registration counts over time by state and fuel type
-
Transit Buses by Fuel Type
Trend of buses powered by various fuels in the United States, 2007-2023
Last update September 2025

-
Law and Incentive Additions by Fuel/Technology Type
Trend of state law and incentive enactments, listed by the targeted technology or fuel type, from 2002 to 2024
Last update February 2026 -
Light-Duty AFV, HEV, and Diesel Model Offerings, by Technology/Fuel
Trend of vehicle models incorporating various advanced technologies or alternative fuels, from 1991 through 2025
Last update March 2026 -
Propane Fueling Station Locations by State
Displays states and their respective propane station counts
-
Propane Laws and Incentives by State
Displays states and their respective law and incentive counts related to the use of propane
-
TransAtlas
Interactive map displays light-duty vehicle registration counts over time by state and fuel type
-
Law and Incentive Additions by Fuel/Technology Type
Trend of state law and incentive enactments, listed by the targeted technology or fuel type, from 2002 to 2024
Last update February 2026 -
Light-Duty AFV, HEV, and Diesel Model Offerings, by Technology/Fuel
Trend of vehicle models incorporating various advanced technologies or alternative fuels, from 1991 through 2025
Last update March 2026 -
TransAtlas
Interactive map displays light-duty vehicle registration counts over time by state and fuel type
-
Transit Buses by Fuel Type
Trend of buses powered by various fuels in the United States, 2007-2023
Last update September 2025 -
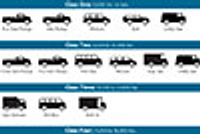
Types of Vehicles by Weight Class
Chart shows typical vehicle types within the Federal Highway Administration (FHWA) vehicle classes
Last update June 2012 -
U.S. Biodiesel Production, Exports, and Consumption
Trend of biodiesel production, exports, and consumption from 2001 to 2025
Last update May 2026