Maps and Data
Find maps and charts showing transportation data and trends related to alternative fuels and vehicles.
-
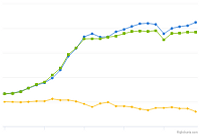
U.S. Production, Consumption, and Trade of Ethanol
Trend of total ethanol fuel production and consumption from 2000 to 2024
Last update January 2026 -
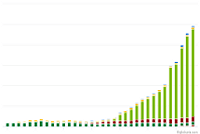
U.S. Public and Private Alternative Fueling Stations by Fuel Type
Trend of alternative fueling station counts by fuel type in the United States from 1992 to 2025
Last update January 2026 -
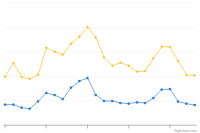
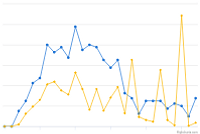
U.S. Soybean and Corn Prices
Trend of soybean and corn prices, adjusted for inflation, from 2002 to 2025
Last update June 2026 -
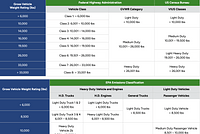
Vehicle Weight Classes and Categories
Charts illustrate the vehicle weight classes and categories used by the Federal Highway Administration (FHWA), the U.S. Census Bureau, and the U.S. Environmental Protection Agency (EPA).
Last update June 2012
-
U.S. Public and Private Alternative Fueling Stations by Fuel Type
Trend of alternative fueling station counts by fuel type in the United States from 1992 to 2025
Last update January 2026 -
Vehicle Credits Traded by Regulated Fleets
Trend of State & Alternative Fuel Provider (S&FP) EPAct credits traded and transactions from 1997 to 2024
Last update February 2026 -
Vehicle Weight Classes and Categories
Charts illustrate the vehicle weight classes and categories used by the Federal Highway Administration (FHWA), the U.S. Census Bureau, and the U.S. Environmental Protection Agency (EPA).
Last update June 2012
-
U.S. Public and Private Alternative Fueling Stations by Fuel Type
Trend of alternative fueling station counts by fuel type in the United States from 1992 to 2025
Last update January 2026 -
U.S. Soybean and Corn Prices
Trend of soybean and corn prices, adjusted for inflation, from 2002 to 2025
Last update June 2026 -
Vehicle Weight Classes and Categories
Charts illustrate the vehicle weight classes and categories used by the Federal Highway Administration (FHWA), the U.S. Census Bureau, and the U.S. Environmental Protection Agency (EPA).
Last update June 2012
-
U.S. Public and Private Alternative Fueling Stations by Fuel Type
Trend of alternative fueling station counts by fuel type in the United States from 1992 to 2025
Last update January 2026 -
Vehicle Weight Classes and Categories
Charts illustrate the vehicle weight classes and categories used by the Federal Highway Administration (FHWA), the U.S. Census Bureau, and the U.S. Environmental Protection Agency (EPA).
Last update June 2012