Maps and Data
Find maps and charts showing transportation data and trends related to alternative fuels and vehicles.
-
Clean Cities and Communities Alternative Fuel Vehicle Inventory
Alternative fuel vehicle inventory reported by Clean Cities and Communities coalitions from 2004 to 2024
Last update June 2026 -
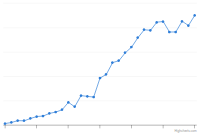
Clean Cities and Communities Annual Energy Use Impact
Trend of reduced fuel use and increased fuel diversity from 1994 to 2024
Last update June 2026 -
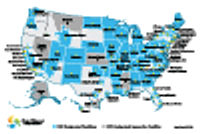
Clean Cities and Communities Coalition Locations
Displays coalition locations and boundaries across the United States
Last update March 2026 -
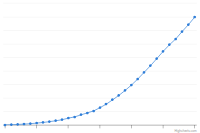
Clean Cities and Communities Cumulative Energy Use Impact
Cumulative trend of reduced fuel use and increased fuel diversity from 1994 to 2024
Last update June 2026 -
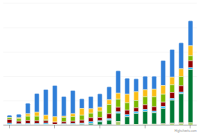
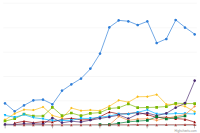
Clean Cities and Communities Energy Use Impact by AFV Type
Trend of energy impact by fuels used in alternative fuel vehicles (AFVs) from 2004 to 2024
Last update June 2026 -
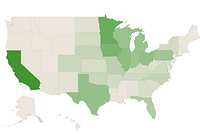
E85 Fueling Station Locations by State
Displays states and their respective E85 station counts
-
Ethanol Laws and Incentives by State
Displays states and their respective law and incentive counts related to the use of ethanol

-
Clean Cities and Communities Alternative Fuel Vehicle Inventory
Alternative fuel vehicle inventory reported by Clean Cities and Communities coalitions from 2004 to 2024
Last update June 2026 -
Clean Cities and Communities Annual Energy Use Impact
Trend of reduced fuel use and increased fuel diversity from 1994 to 2024
Last update June 2026 -
Clean Cities and Communities Coalition Locations
Displays coalition locations and boundaries across the United States
Last update March 2026 -
Clean Cities and Communities Cumulative Energy Use Impact
Cumulative trend of reduced fuel use and increased fuel diversity from 1994 to 2024
Last update June 2026 -
Clean Cities and Communities Energy Use Impact by AFV Type
Trend of energy impact by fuels used in alternative fuel vehicles (AFVs) from 2004 to 2024
Last update June 2026 -
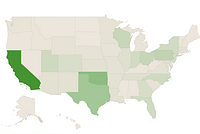
Compressed Natural Gas Fueling Stations by State
Displays states and their respective compressed natural gas (CNG) station counts
-
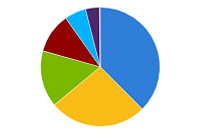
Consumption of Natural Gas in the United States
U.S. natural gas consumption by end use in 2022
Last update January 2024
-
Clean Cities and Communities Alternative Fuel Vehicle Inventory
Alternative fuel vehicle inventory reported by Clean Cities and Communities coalitions from 2004 to 2024
Last update June 2026 -
Clean Cities and Communities Annual Energy Use Impact
Trend of reduced fuel use and increased fuel diversity from 1994 to 2024
Last update June 2026 -
Clean Cities and Communities Cumulative Energy Use Impact
Cumulative trend of reduced fuel use and increased fuel diversity from 1994 to 2024
Last update June 2026 -
Clean Cities and Communities Energy Use Impact by AFV Type
Trend of energy impact by fuels used in alternative fuel vehicles (AFVs) from 2004 to 2024
Last update June 2026
-
Clean Cities and Communities Annual Energy Use Impact
Trend of reduced fuel use and increased fuel diversity from 1994 to 2024
Last update June 2026 -
Clean Cities and Communities Coalition Locations
Displays coalition locations and boundaries across the United States
Last update March 2026 -
Clean Cities and Communities Cumulative Energy Use Impact
Cumulative trend of reduced fuel use and increased fuel diversity from 1994 to 2024
Last update June 2026 -
Clean Cities and Communities Energy Use Impact by AFV Type
Trend of energy impact by fuels used in alternative fuel vehicles (AFVs) from 2004 to 2024
Last update June 2026
-
Clean Cities and Communities Annual Energy Use Impact
Trend of reduced fuel use and increased fuel diversity from 1994 to 2024
Last update June 2026 -
Clean Cities and Communities Coalition Locations
Displays coalition locations and boundaries across the United States
Last update March 2026 -
Clean Cities and Communities Cumulative Energy Use Impact
Cumulative trend of reduced fuel use and increased fuel diversity from 1994 to 2024
Last update June 2026