Maps and Data - Fuel Economy at Various Driving Speeds
Find maps and charts showing transportation data and trends related to alternative fuels and vehicles.
-
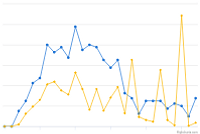
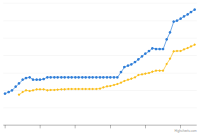
EPAct State & Alternative Fuel Provider Fleet Exemptions
Trend of State & Alternative Fuel Provider (S&FP) exemption requests and vehicles exempted from 1997 to 2024
Last update February 2026 -
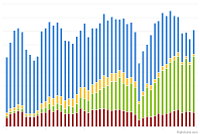
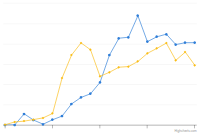
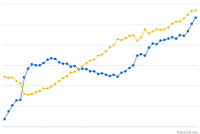
Light-Duty AFV, HEV, and Diesel Model Offerings, by Technology/Fuel
Trend of vehicle models incorporating various advanced technologies or alternative fuels, from 1991 through 2025
Last update March 2026 -
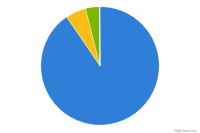
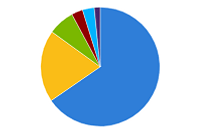
Light-Duty AFV Registrations
Breakdown of alternative fuel vehicle (AFV) registrations by fuel type
Last update June 2024 -
TransAtlas
Interactive map displays light-duty vehicle registration counts over time by state and fuel type
-
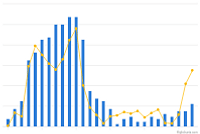
Transit Buses by Fuel Type
Trend of buses powered by various fuels in the United States, 2007-2023
Last update September 2025 -
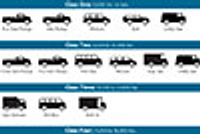
Types of Vehicles by Weight Class
Chart shows typical vehicle types within the Federal Highway Administration (FHWA) vehicle classes
Last update June 2012 -
Vehicle Credits Traded by Regulated Fleets
Trend of State & Alternative Fuel Provider (S&FP) EPAct credits traded and transactions from 1997 to 2024
Last update February 2026 -
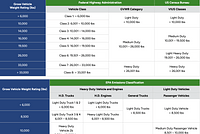
Vehicle Weight Classes and Categories
Charts illustrate the vehicle weight classes and categories used by the Federal Highway Administration (FHWA), the U.S. Census Bureau, and the U.S. Environmental Protection Agency (EPA).
Last update June 2012


-
Average Annual Fuel Use by Vehicle Type
Comparison of fuel use (per vehicle) among vehicle types
Last update December 2025 -
Average Annual Vehicle Miles Traveled by Major Vehicle Category
Comparison of miles traveled (per vehicle) among vehicle types
Last update March 2026 -
Average Fuel Economy by Major Vehicle Category
Comparison of fuel economy among vehicle types
Last update May 2026 -
Average Per-Passenger Fuel Economy by Travel Mode
Comparison of per-passenger fuel economy for various modes of transportation
Last update October 2022 -
Clean Cities and Communities Energy Use Impact by VMT Reduction and FE
Trend of energy impact by fuel economy (FE) improvements and reductions in vehicle miles traveled (VMT) from 2004 to 2024
Last update June 2026 -
Clean Cities and Communities Energy Use Impact through Idle Reduction
Trend of energy impact by idle reduction policies and technologies from 2004 to 2024
Last update June 2026 -
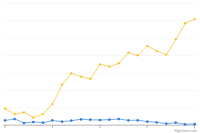
Composition of New U.S. Light-Duty Vehicles by Vehicle Type
Trend showing the shift in popularity of trucks versus cars by year
Last update January 2026 -
Energy Expenditures by Sector
Trend of U.S. transportation and residential energy expenditures, per capita, from 1970 to 2022
Last update January 2024 -
Fuel Economy and Consumption of Light-Duty Vehicles
Relationship between fuel economy and lifetime fuel consumption for light-duty vehicles
Last update May 2021 -
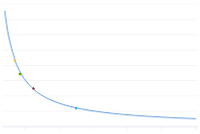
Fuel Economy at Various Driving Speeds
Trend of fuel efficiency at different vehicle speeds, grouped by fuel type
Last update May 2021 -
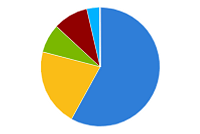
Fuel Use by Transportation Mode in 2019
Breakdown of fuel used in the United States by transportation mode, 2019
Last update May 2023 -
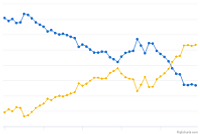
Power and Fuel Economy of the Average Light-Duty Vehicle
Trend of vehicle horsepower and fuel economy from 1975 to 2024
Last update January 2026 -
Vehicle Fuel Efficiency (CAFE) Requirements by Year
Trend of Corporate Average Fuel Economy (CAFE) vehicle fuel efficiency standards from 1978 to 2032
Last update June 2026


-
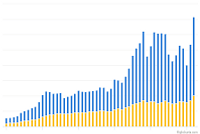
Light-Duty Vehicles Produced in the United States
Trend in the number and types of light-duty vehicles produced from 1975 to 2023
Last update October 2024 -
TransAtlas
Interactive map displays light-duty vehicle registration counts over time by state and fuel type
-
Types of Vehicles by Weight Class
Chart shows typical vehicle types within the Federal Highway Administration (FHWA) vehicle classes
Last update June 2012 -
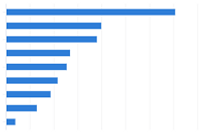
U.S. Vehicles by Transportation Mode
Breakdown of self-propelled vehicles by transportation mode in the United States (2024)
Last update June 2026