Maps and Data
Find maps and charts showing transportation data and trends related to alternative fuels and vehicles.
-
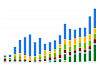
AFV and HEV Model Offerings, by Manufacturer
Trend of alternative fuel vehicle (AFV) and hybrid electric vehicle (HEV) models by manufacturer, 1991-2024
Last update October 2024 -
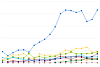
Efficiency Ratios for Light-Duty All-Electric Vehicles in the United States
Provides efficiency ratios of on-road all-electric vehicles in the United States in 2021, based on vehicle registration data.
Last update September 2024 -
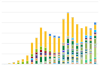
AFV Acquisitions by Regulated Fleets (by Fleet Type)
Trend of State & Alternative Fuel Provider (S&FP) alternative fuel vehicle (AFV) acquisitions by fleet type from 1992 to 2023
Last update June 2024 -
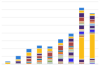
AFV Acquisitions by Regulated Fleets (by Fuel Type)
Trend of State & Alternative Fuel Provider (S&FP) alternative fuel vehicle (AFV) acquisitions by fuel type from 1992 to 2023
Last update June 2024 -
EPAct State & Alternative Fuel Provider Fleet Exemptions
Trend of State & Alternative Fuel Provider (S&FP) exemption requests and vehicles exempted from 1997 to 2023
Last update June 2024 -
Light-Duty AFV Registrations
Breakdown of alternative fuel vehicle (AFV) registrations by fuel type
Last update June 2024 -
Light-Duty AFV, HEV, and Diesel Model Offerings, by Technology/Fuel
Trend of vehicle models incorporating various advanced technologies or alternative fuels, from 1991 through 2024
Last update May 2024 -
Annual Vehicle Credits Earned and Used by Regulated Fleets
Trend of State & Alternative Fuel Provider (S&FP) EPAct credits traded and transactions from 1999 to 2023
Last update May 2024 -
Biodiesel Purchases by EPAct-Regulated Fleets
Trend of State and Alternative Fuel Provider Biodiesel Purchases from 2000 to 2023
Last update May 2024 -
Vehicle Credits Traded by Regulated Fleets
Trend of State & Alternative Fuel Provider (S&FP) EPAct credits traded and transactions from 1997 to 2023
Last update May 2024 -
Transit Buses by Fuel Type
Trend of buses powered by various fuels in the United States, 2007-2021
Last update April 2024 -
Clean Cities and Communities Alternative Fuel Vehicle Inventory
Alternative fuel vehicle inventory reported by Clean Cities and Communities coalitions from 2004 to 2022
Last update February 2024 -
Clean Cities and Communities Energy Use Impact by AFV Type
Trend of energy impact by fuels used in alternative fuel vehicles (AFVs) from 2004 to 2022
Last update February 2024 -
U.S. HEV Sales by Model
Trend of sales by hybrid electric vehicle (HEV) model, 1999-2019
Last update January 2020 -
U.S. Plug-in Electric Vehicle Sales by Model
Trend of sales by PEV model, 2011-2019
Last update January 2020 -
Types of Vehicles by Weight Class
Chart shows typical vehicle types within the Federal Highway Administration (FHWA) vehicle classes
Last update June 2012 -
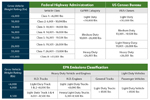
Vehicle Weight Classes & Categories
Charts illustrate the vehicle weight classes and categories used by the Federal Highway Administration (FHWA), the U.S. Census Bureau, and the U.S. Environmental Protection Agency (EPA).
Last update June 2012 -
TransAtlas
Interactive map displays light-duty vehicle registration counts over time by state and fuel type