Maps and Data
Find maps and charts showing transportation data and trends related to alternative fuels and vehicles.
OR
-
-
Clean Cities and Communities Energy Use Impact by AFV Type
-
-
-
Fuel Economy and Consumption of Light-Duty Vehicles
-
-
-
Fuel Economy at Various Driving Speeds
-
-
-
Clean Cities and Communities Energy Use Impact by VMT Reduction and FE
-
-
-
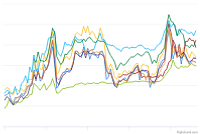
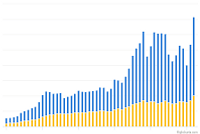
Average Retail Fuel Prices in the United States
-
-
-
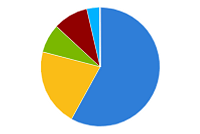
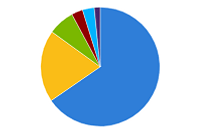
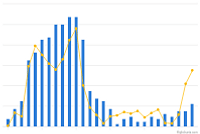
Light-Duty AFV Registrations
-
-
-
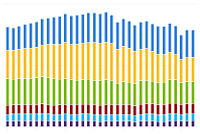
Greenhouse Gas Emissions by Economic Sector
-
-
-
Clean Cities and Communities Alternative Fuel Vehicle Inventory
-
-
-
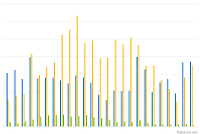
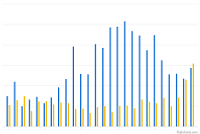
AFV Requirements, Acquisitions, and Credits for Federal Agencies
-
-
-
Annual Vehicle Credits Earned and Used by Regulated Fleets
-
-
-
Average Per-Passenger Fuel Economy by Travel Mode
-
-
-
Energy Expenditures by Sector
-
-
-
EPAct State & Alternative Fuel Provider Fleet Exemptions
-
-
-
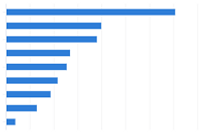
Fuel Use by Transportation Mode in 2019
-
Clean Cities and Communities Energy Use Impact by AFV Type
2004 | 2005 | 2006 | 2007 | 2008 | 2009 | 2010 | 2011 | 2012 | 2013 | 2014 | 2015 | 2016 | 2017 | 2018 | 2019 | 2020 | 2021 | 2022 | |
CNG | 88.8 | 56 | 81 | 102 | 104 | 85.39756598774 | 140.639750788926 | 167.32500090109 | 191 | 231 | 293 | 401.960513 | 429.987053963053 | 426.318935346672 | 410.838932359052 | 425.900192900251 | 337.06442101768 | 354.061453372782 | 431.726261448313 |
Biodiesel | 21.4 | 47 | 63.2 | 61 | 74 | 38.976619934563 | 28.520535473764 | 69.569124655012 | 59 | 61 | 59 | 77.516645 | 101.610631116561 | 93.774211532389 | 116.160361171739 | 116.797499870001 | 125.22720486304 | 85.253661644473 | 84.008980460196 |
E85 | 16.3 | 26 | 45 | 37 | 37 | 72.782845279809 | 38.57599089271499 | 49.009439227048 | 38 | 48 | 51 | 67.802986 | 71.18559914234699 | 86.329817691757 | 70.999215209997 | 71.926069836584 | 73.15335926464 | 75.943528695295 | 89.70922888663 |
LNG | 8 | 15.7 | 9 | 14 | 11.938719867465 | 23.419107788602 | 27.752052240664 | 21 | 22 | 34 | 53.364901 | 45.19919701296 | 47.108725561875 | 51.693796451046 | 42.631940484204 | 30.89665450165 | 32.242056907064 | 26.509721834882 | |
Propane | 39.4 | 32 | 42 | 30 | 25 | 18.228815452377 | 18.259948864866 | 19.017091551984 | 27 | 27 | 32 | 36.947498 | 45.49738144944601 | 44.428882259001 | 52.384221072108 | 61.910757962898 | 45.25336003545 | 45.112051251883 | 47.046057425296 |
Electric | 3 | 2 | 5 | 5 | 4 | 29.35438018214 | 9 | 15.525042870543 | 12 | 20 | 27 | 33.256536 | 40.709187818852 | 26.312029314231 | 44.981593181569 | 48.8264802229 | 38.70357436369 | 48.329303 | 71.592703387349 |
Renewable Diesel | 1.047264 | 35.108883246537 | 19.071715274754 | 24.373104292499 | 25.753570584669 | 19.676749 | 27.791402 | 35.197514 | |||||||||||
RNG | 0.7 | 1.254535 | 7.459188349601001 | 13.036133356623 | 16.085052851034 | 18.843881762462 | 33.96463850553 | 24.107814670123 | 30.117269894816 | ||||||||||
Hydrogen | 0.05 | 0.09 | 0.12 | 0.07 | 0.048755537688 | 0.03 | 0.288231374441 | 0.14 | 0.33 | 0.32 | 0.622438 | 0.43718225814999995 | 0.29504611817 | 1.853781751096 | 0.510274415799 | 0.58783309746 | 0.700303542524 | 0.459528381828 |
Notes: Energy use impact is a metric that measures the quantity of conventional fuel that was shifted to clean, domestic, economical sources, such as alternative fuels, or saved through efficiency improvements. Measured in gasoline gallon equivalents (GGEs), representing a quantity of fuel with the same amount of energy contained in a gallon of gasoline.
This chart shows the annual energy impact of Clean Cities and Communities coalition activities through various types of alternative fuel vehicles (AFVs).
To view more details, notes, and acronyms, please download the Excel spreadsheet.
Print