Maps and Data - Greenhouse Gas Reductions in Light- and Heavy-Duty Vehicles
Find maps and charts showing transportation data and trends related to alternative fuels and vehicles.
OR
Sort by:
119 results
-
Fuels & Infrastructure: Fuel Trends
-
-
Average Annual Retail Fuel Price of Gasoline
Trend of gasoline prices, actual and inflation-adjusted, from 1950 to 2023 Last update January 2024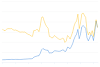
-
-
-
Average Renewable Diesel and Diesel Fuel Prices in California
Trend of renewable diesel and diesel motor fuel prices in California from 2017 to 2024 Last update February 2024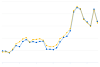
-
-
-
Average Retail Fuel Prices in the United States
Trend of alternative and traditional motor fuel prices from 2000 to 2024 Last update February 2024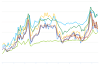
-
-
-
Change in U.S. Vehicle Registration Counts
Trend of light-duty vehicle registrations by fuel type, measured in percent change from 2016 through 2020 Last update September 2021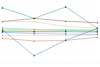
-
-
-
Consumption of Natural Gas in the United States
U.S. natural gas consumption by end use in 2022 Last update January 2024
-
-
-
Energy Use by Transportation Mode and Fuel Type
Amount of energy consumed through different transportation modes, 2019 Last update May 2023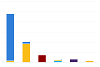
-
-
-
Fuel Taxes by Country
Comparison of gasoline and diesel taxes in Organization for Economic Cooperation and Development countries Last update March 2019
-
-
-
Fuel Use by Transportation Mode in 2019
Breakdown of fuel used in the United States by transportation mode, 2019 Last update May 2023
-
-
-
Global Ethanol Production by Country or Region
Quantity of ethanol produced by country/region from 2007 to 2022 Last update January 2024
-
-
-
Renewable Diesel Production and Consumption
Renewable diesel domestic production and consumption from 2013 to 2022 Last update November 2023
-
-
-
Sustainable Aviation Fuel Estimated Consumption
Estimated U.S. consumption of sustainable aviation fuel from 2016 to 2022 Last update April 2023
-
-
-
U.S. Biodiesel Production, Exports, and Consumption
Trend of biodiesel production, exports, and consumption from 2001 to 2023 Last update April 2024
-
-
-
U.S. Crude Oil Imports by Country of Origin
Quantity of oil imports by country of production, from 1973 to 2023 Last update December 2023
-
-
-
U.S. Production, Consumption, and Trade of Ethanol
Trend of total ethanol fuel production and consumption from 2000 to 2023 Last update April 2024
-
-
-
U.S. Production, Consumption, and Trade of Petroleum Products
Trend of total petroleum product production, consumption, and trade from 1949 to 2023 Last update November 2023
-
-
-
U.S. Renewable Diesel Imports
Renewable diesel fuel imports to the United States from 2015 to 2022 Last update November 2023
-
-
Fuels & Infrastructure: Emissions
-
-
Greenhouse Gas Emissions by Economic Sector
Trend of U.S. greenhouse gas emission for each economic sector Last update August 2022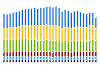
-
-
Fuels & Infrastructure: Alternative Fueling Stations
-
-
Biodiesel Fueling Station Locations by State
Displays states and their respective biodiesel station counts
-
-
-
Compressed Natural Gas Fueling Stations by State
Displays states and their respective compressed natural gas (CNG) station counts
-
-
-
E85 Fueling Station Locations by State
Displays states and their respective E85 station counts
-
-
-
Electric Vehicle Charging Ports by State
Displays states and their respective EV charging port counts
-
-
-
Hydrogen Fueling Station Locations by State
Displays states and their respective hydrogen station counts
-
-
-
Liquefied Natural Gas Fueling Stations by State
Displays states and their respective liquefied natural gas (LNG) station counts
-
-
-
Propane Fueling Station Locations by State
Displays states and their respective propane station counts
-
-
-
Renewable Diesel Fueling Station Locations by State
Displays states and their respective renewable diesel station counts
-

Greenhouse Gas Reductions in Light- and Heavy-Duty Vehicles
| Gasoline | Diesel | Propane | LNG | CNG | Ethanol (Corn) | H2 (SMR) | Electricity | Biodiesel | Renewable Diesel | RNG (Landfill) | Fuel Economy | Idle Reduction | VMT Reduction | RNG (Animal) | RNG (Wastewater) | |
| Light-Duty Vehicles | 0 | -13 | -16 | -40 | -43 | -61 | -68 | -80 | -84 | -100 | -100 | -100 | -130 | -146 | ||
| Heavy-Duty Vehicles | 0 | 3 | -3 | -7 | -46 | -61 | -61 | -76 | -83 | -100 | -100 | -100 | -133 | -151 |
Source: Derived from AFLEET 2020 for the Clean Cities and Communities Coalition Network. Data reflect input values deemed applicable to the average or majority of U.S. drivers at a national level.
This figure compares the greenhouse gases (GHGs) emitted by various fuels over their lifecycle when achieving the same transportation objectives. Propane and CNG emit 13% and 16% fewer GHGs than conventional gasoline in light-duty vehicles (LDVs). Corn ethanol and hydrogen produced from steam-methane reforming (currently the most common source of hydrogen) both reduce emissions about 40% over their lifecycles. Electricity (assuming the nationwide average grid mix) and biodiesel both reduce emissions by more than 60%. Fuel economy, idle reduction, and VMT-reduction projects all reduce GHG emissions 100% because they have no alternative or upstream emissions. Renewable natural gas reduces emissions by 84%-146%, depending on the source, because these projects keep methane from venting to the atmosphere. Greenhouse gas reductions from heavy-duty vehicles (HDVs) are similar to those of LDVs, but slightly smaller because diesel engines (which are the baseline for this chart) are more efficient than gasoline engines.
To view more details, notes, and acronyms, please download the Excel spreadsheet.
Print