Maps and Data
Find maps and charts showing transportation data and trends related to alternative fuels and vehicles.
-
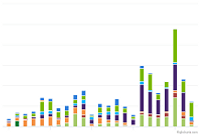
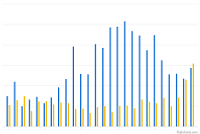
Law and Incentive Additions by Fuel/Technology Type
Trend of state law and incentive enactments, listed by the targeted technology or fuel type, from 2002 to 2024
Last update February 2026 -
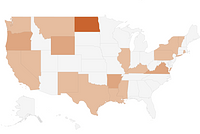
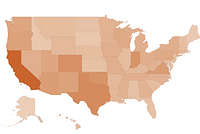
Renewable Diesel Laws and Incentives by State
Displays states and their respective law and incentive counts related to the use of renewable diesel
-
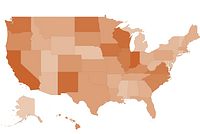
Biodiesel Laws and Incentives by State
Displays states and their respective law and incentive counts related to the use of biodiesel
-
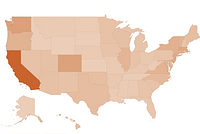
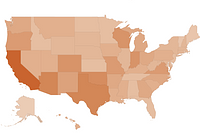
Electric Vehicle Laws and Incentives by State
Displays states and their respective law and incentive counts related to electric vehicles
-
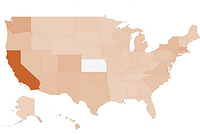
Hydrogen Laws and Incentives by State
Displays states and their respective law and incentive counts related to the use of hydrogen
-
Ethanol Laws and Incentives by State
Displays states and their respective law and incentive counts related to the use of ethanol
-
Natural Gas Laws and Incentives by State
Displays states and their respective law and incentive counts related to the use of natural gas
-
Propane Laws and Incentives by State
Displays states and their respective law and incentive counts related to the use of propane
-
Incentive Additions by Policy Type
Trend of state law and incentive enactments listed by incentive type from 2002 to 2024
Last update February 2026 -
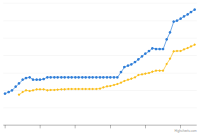
Fuel Taxes by Country
Comparison of gasoline and diesel taxes in eight nations from 2010-2023
Last update June 2026 -
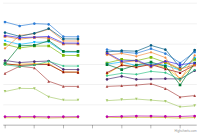
Vehicle Fuel Efficiency (CAFE) Requirements by Year
Trend of Corporate Average Fuel Economy (CAFE) vehicle fuel efficiency standards from 1978 to 2032
Last update June 2026 -
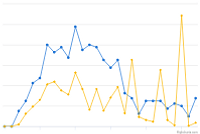
Annual Vehicle Credits Earned and Used by Regulated Fleets
Trend of State & Alternative Fuel Provider (S&FP) EPAct credits traded and transactions from 1999 to 2024
Last update February 2026 -
EPAct State & Alternative Fuel Provider Fleet Exemptions
Trend of State & Alternative Fuel Provider (S&FP) exemption requests and vehicles exempted from 1997 to 2024
Last update February 2026 -
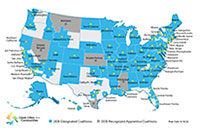
Clean Cities and Communities Coalition Locations
Displays coalition locations and boundaries across the United States
Last update June 2026 -
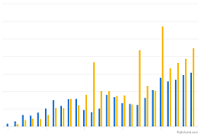
Vehicle Credits Traded by Regulated Fleets
Trend of State & Alternative Fuel Provider (S&FP) EPAct credits traded and transactions from 1997 to 2024
Last update February 2026 -
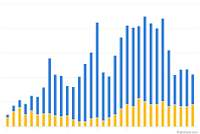
AFV Acquisitions by Regulated Fleets (by Fleet Type)
Trend of State & Alternative Fuel Provider (S&FP) alternative fuel vehicle (AFV) acquisitions by fleet type from 1992 to 2024
Last update February 2026 -
Biodiesel Purchases by EPAct-Regulated Fleets
Trend of State and Alternative Fuel Provider Biodiesel Purchases from 2000 to 2024
Last update February 2026 -
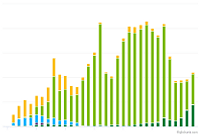
AFV Acquisitions by Regulated Fleets (by Fuel Type)
Trend of State & Alternative Fuel Provider (S&FP) alternative fuel vehicle (AFV) acquisitions by fuel type from 1992 to 2024
Last update February 2026 -
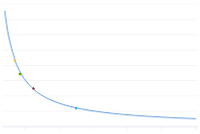
Fuel Economy and Consumption of Light-Duty Vehicles
Relationship between fuel economy and lifetime fuel consumption for light-duty vehicles
Last update May 2021 -
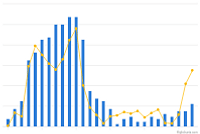
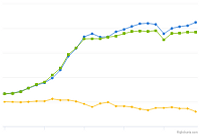
U.S. Production, Consumption, and Trade of Ethanol
Trend of total ethanol fuel production and consumption from 2000 to 2024
Last update January 2026