Maps and Data - Greenhouse Gas Reductions in Light- and Heavy-Duty Vehicles
Find maps and charts showing transportation data and trends related to alternative fuels and vehicles.
OR
Sort by:
119 results
-
Vehicles: Fuel Consumption and Efficiency
-
-
Fuel Economy and Consumption of Light-Duty Vehicles
Relationship between fuel economy and lifetime fuel consumption for light-duty vehicles Last update May 2021
-
-
-
Fuel Economy at Various Driving Speeds
Trend of fuel efficiency at different vehicle speeds, grouped by fuel type Last update May 2021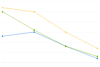
-
-
-
Fuel Use by Transportation Mode in 2019
Breakdown of fuel used in the United States by transportation mode, 2019 Last update May 2023
-
-
-
Power and Fuel Economy of the Average Light-Duty Vehicle
Trend of vehicle horsepower and fuel economy from 1975 to 2023 Last update February 2024
-
-
-
Vehicle Fuel Efficiency (CAFE) Requirements by Year
Trend of Corporate Average Fuel Economy (CAFE) vehicle fuel efficiency standards from 1978 to 2025 Last update September 2013
-
-
Vehicles: Vehicle Market
-
-
AFV and HEV Model Offerings, by Manufacturer
Trend of alternative fuel vehicle (AFV) and hybrid electric vehicle (HEV) models by manufacturer, 1991-2024 Last update May 2024
-
-
-
Efficiency Ratios for Light-Duty All-Electric Vehicles in the United States
Provides efficiency ratios of on-road all-electric vehicles in the United States in 2021, based on vehicle registration data. Last update June 2023
-
-
-
Light-Duty Vehicles Produced in the United States
Trend in the number and types of light-duty vehicles produced from 1975 to 2020 Last update May 2023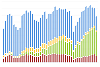
-
-
-
TransAtlas
Interactive map displays light-duty vehicle registration counts over time by state and fuel type
-
-
-
Types of Vehicles by Weight Class
Chart shows typical vehicle types within the Federal Highway Administration (FHWA) vehicle classes Last update June 2012
-
-
-
U.S. Vehicles by Transportation Mode
Breakdown of self-propelled vehicles by transportation mode in the United States (2021) Last update January 2024
-
-
-
Vehicle Weight Classes & Categories
Charts illustrate the vehicle weight classes and categories used by the Federal Highway Administration (FHWA), the U.S. Census Bureau, and the U.S. Environmental Protection Agency (EPA). Last update June 2012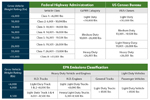
-
-
Vehicles: Driving Patterns
-
-
Annual Vehicle Miles Traveled in the United States
Trend of vehicle miles traveled from 1970 to 2023 Last update January 2024
-
-
-
Average Fuel Economy by Major Vehicle Category
Comparison of fuel economy among vehicle types Last update January 2024
-
-
-
Average Monthly Fluctuation in U.S. Vehicle Miles Traveled
U.S. vehicle miles traveled for each month of the year, averaged from 2010 to 2023 Last update December 2023
-
-
-
Average Vehicle Trip Length by Purpose (2017)
Comparison of average vehicle trip length by purpose in the United States Last update October 2022
-
-
-
Means of Transportation to Work
Trend of how people commuted to work in the United States from 1980 to 2019 Last update June 2022
-
-
-
Share of All U.S. Vehicle Trips by Length (miles)
Breakdown of trip lengths among all vehicle trips Last update January 2024
-
-
Laws & Incentives
-
-
Biodiesel Laws and Incentives by State
Displays states and their respective law and incentive counts related to the use of biodiesel
-
-
-
Electric Vehicle Laws and Incentives by State
Displays states and their respective law and incentive counts related to electric vehicles
-
-
-
Ethanol Laws and Incentives by State
Displays states and their respective law and incentive counts related to the use of ethanol
-
-
-
Fuel Taxes by Country
Comparison of gasoline and diesel taxes in Organization for Economic Cooperation and Development countries Last update March 2019
-
-
-
Hydrogen Laws and Incentives by State
Displays states and their respective law and incentive counts related to the use of hydrogen
-
-
-
Incentive Additions by Policy Type
Trend of state law and incentive enactments listed by incentive type from 2002 to 2023 Last update April 2024
-
-
-
Law and Incentive Additions by Fuel/Technology Type
Trend of state law and incentive enactments, listed by the targeted technology or fuel type, from 2002 to 2023 Last update April 2024
-

Greenhouse Gas Reductions in Light- and Heavy-Duty Vehicles
| Gasoline | Diesel | Propane | LNG | CNG | Ethanol (Corn) | H2 (SMR) | Electricity | Biodiesel | Renewable Diesel | RNG (Landfill) | Fuel Economy | Idle Reduction | VMT Reduction | RNG (Animal) | RNG (Wastewater) | |
| Light-Duty Vehicles | 0 | -13 | -16 | -40 | -43 | -61 | -68 | -80 | -84 | -100 | -100 | -100 | -130 | -146 | ||
| Heavy-Duty Vehicles | 0 | 3 | -3 | -7 | -46 | -61 | -61 | -76 | -83 | -100 | -100 | -100 | -133 | -151 |
Source: Derived from AFLEET 2020 for the Clean Cities and Communities Coalition Network. Data reflect input values deemed applicable to the average or majority of U.S. drivers at a national level.
This figure compares the greenhouse gases (GHGs) emitted by various fuels over their lifecycle when achieving the same transportation objectives. Propane and CNG emit 13% and 16% fewer GHGs than conventional gasoline in light-duty vehicles (LDVs). Corn ethanol and hydrogen produced from steam-methane reforming (currently the most common source of hydrogen) both reduce emissions about 40% over their lifecycles. Electricity (assuming the nationwide average grid mix) and biodiesel both reduce emissions by more than 60%. Fuel economy, idle reduction, and VMT-reduction projects all reduce GHG emissions 100% because they have no alternative or upstream emissions. Renewable natural gas reduces emissions by 84%-146%, depending on the source, because these projects keep methane from venting to the atmosphere. Greenhouse gas reductions from heavy-duty vehicles (HDVs) are similar to those of LDVs, but slightly smaller because diesel engines (which are the baseline for this chart) are more efficient than gasoline engines.
To view more details, notes, and acronyms, please download the Excel spreadsheet.
Print