Maps and Data
Find maps and charts showing transportation data and trends related to alternative fuels and vehicles.
-
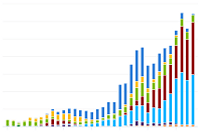
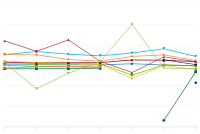
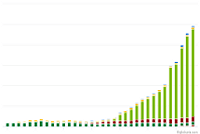
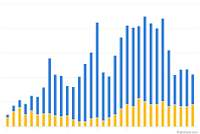
Light-Duty AFV, HEV, and Diesel Model Offerings, by Technology/Fuel
Trend of vehicle models incorporating various advanced technologies or alternative fuels, from 1991 through 2024
Last update May 2024 -
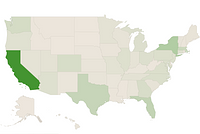
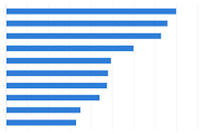
Electric Vehicle Charging Ports by State
Displays states and their respective EV charging port counts
-
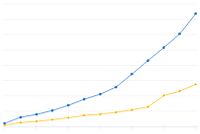
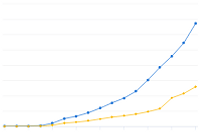
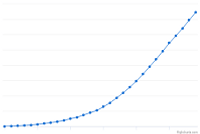
U.S. Public and Private Electric Vehicle Charging Infrastructure
Trend of public and private electric vehicle charging infrastructure in the United States from 2011 to 2023
Last update March 2024 -
Electric Vehicle Laws and Incentives by State
Displays states and their respective law and incentive counts related to electric vehicles
-
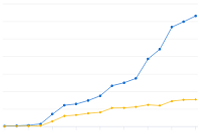
U.S. Public Electric Vehicle Charging Infrastructure
Trend of public electric vehicle charging infrastructure in the United States from 2007 to 2023
Last update March 2024 -
U.S. Private Electric Vehicle Charging Infrastructure
Trend of private electric vehicle charging infrastructure in the United States from 2007 to 2023
Last update March 2024 -
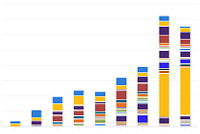
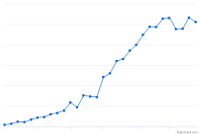
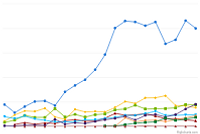
U.S. Plug-in Electric Vehicle Sales by Model
Trend of sales by PEV model, 2011-2019
Last update January 2020 -
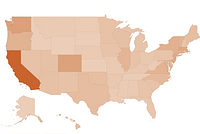
Electric Vehicle Registrations by State
U.S. light-duty electric vehicle population as of December 2023
Last update September 2024 -
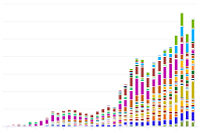
AFV and HEV Model Offerings, by Manufacturer
Trend of alternative fuel vehicle (AFV) and hybrid electric vehicle (HEV) models by manufacturer, 1991-2024
Last update October 2024 -
Change in U.S. Light-Duty Vehicle Registration Counts
Trend of light-duty vehicle registrations by fuel type, measured in percent change from 2016 through 2023
Last update June 2024 -
U.S. HEV Sales by Model
Trend of sales by hybrid electric vehicle (HEV) model, 1999-2019
Last update January 2020 -
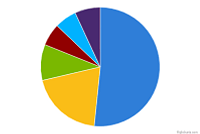
Share of All U.S. Vehicle Trips by Length (miles)
Breakdown of trip lengths among all vehicle trips
Last update January 2026 -
Average Vehicle Trip Length by Purpose (2017)
Comparison of average vehicle trip length by purpose in the United States
Last update October 2022 -
Clean Cities and Communities Cumulative Energy Use Impact
Cumulative trend of reduced fuel use and increased fuel diversity from 1994 to 2023
Last update January 2026 -
Clean Cities and Communities Annual Energy Use Impact
Trend of reduced fuel use and increased fuel diversity from 1994 to 2023
Last update January 2026 -
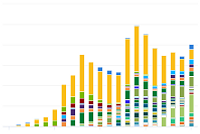
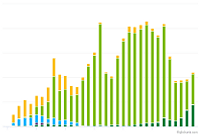
AFV Acquisitions by Regulated Fleets (by Fuel Type)
Trend of State & Alternative Fuel Provider (S&FP) alternative fuel vehicle (AFV) acquisitions by fuel type from 1992 to 2024
Last update February 2026 -
Law and Incentive Additions by Fuel/Technology Type
Trend of state law and incentive enactments, listed by the targeted technology or fuel type, from 2002 to 2024
Last update February 2026 -
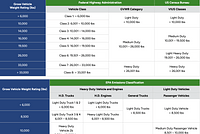
Vehicle Weight Classes and Categories
Charts illustrate the vehicle weight classes and categories used by the Federal Highway Administration (FHWA), the U.S. Census Bureau, and the U.S. Environmental Protection Agency (EPA).
Last update June 2012 -
Clean Cities and Communities Coalition Locations
Displays coalition locations and boundaries across the United States
Last update March 2026 -
TransAtlas
Interactive map displays light-duty vehicle registration counts over time by state and fuel type
-
U.S. Public and Private Alternative Fueling Stations by Fuel Type
Trend of alternative fueling station counts by fuel type in the United States from 1992 to 2025
Last update January 2026 -
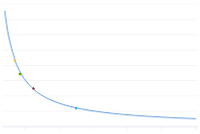
Fuel Economy and Consumption of Light-Duty Vehicles
Relationship between fuel economy and lifetime fuel consumption for light-duty vehicles
Last update May 2021 -
Clean Cities and Communities Energy Use Impact by AFV Type
Trend of energy impact by fuels used in alternative fuel vehicles (AFVs) from 2004 to 2023
Last update January 2026 -
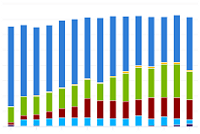
Transit Buses by Fuel Type
Trend of buses powered by various fuels in the United States, 2007-2021
Last update April 2024 -
AFV Acquisitions by Regulated Fleets (by Fleet Type)
Trend of State & Alternative Fuel Provider (S&FP) alternative fuel vehicle (AFV) acquisitions by fleet type from 1992 to 2024
Last update February 2026