Maps and Data - Vehicle Fuel Efficiency (CAFE) Requirements by Year
Find maps and charts showing transportation data and trends related to alternative fuels and vehicles.
-
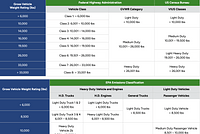
Vehicle Weight Classes and Categories
Charts illustrate the vehicle weight classes and categories used by the Federal Highway Administration (FHWA), the U.S. Census Bureau, and the U.S. Environmental Protection Agency (EPA).
Last update June 2012
-
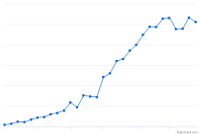
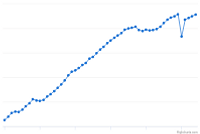
Annual Vehicle Miles Traveled in the United States
Trend of vehicle miles traveled from 1970 to 2025
Last update February 2026 -
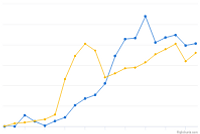
Average Fuel Economy by Major Vehicle Category
Comparison of fuel economy among vehicle types
Last update May 2026 -
Average Monthly Fluctuation in U.S. Vehicle Miles Traveled
U.S. vehicle miles traveled for each month of the year, averaged from 2010 to 2026
Last update May 2026 -
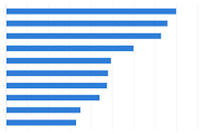
Average Vehicle Trip Length by Purpose (2017)
Comparison of average vehicle trip length by purpose in the United States
Last update October 2022 -
Means of Transportation to Work
Trend of how people commuted to work in the United States from 1980 to 2019
Last update June 2022 -
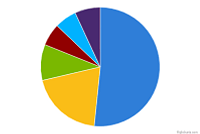
Share of All U.S. Vehicle Trips by Length (miles)
Breakdown of trip lengths among all vehicle trips
Last update January 2026


-
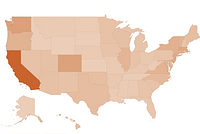
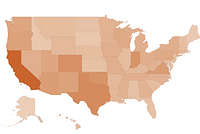
Biodiesel Laws and Incentives by State
Displays states and their respective law and incentive counts related to the use of biodiesel
-
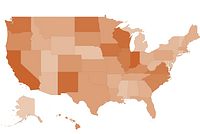
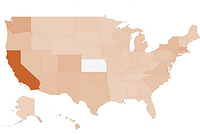
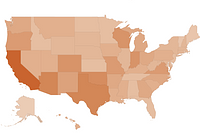
Electric Vehicle Laws and Incentives by State
Displays states and their respective law and incentive counts related to electric vehicles
-
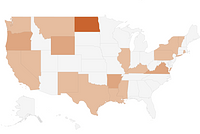
Ethanol Laws and Incentives by State
Displays states and their respective law and incentive counts related to the use of ethanol
-
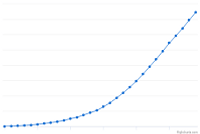
Fuel Taxes by Country
Comparison of gasoline and diesel taxes in eight nations from 2010-2023
Last update June 2026 -
Hydrogen Laws and Incentives by State
Displays states and their respective law and incentive counts related to the use of hydrogen
-
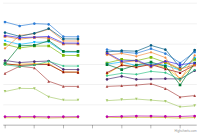
Incentive Additions by Policy Type
Trend of state law and incentive enactments listed by incentive type from 2002 to 2024
Last update February 2026 -
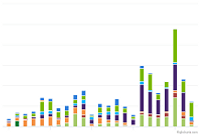
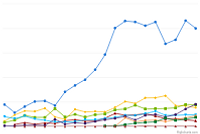
Law and Incentive Additions by Fuel/Technology Type
Trend of state law and incentive enactments, listed by the targeted technology or fuel type, from 2002 to 2024
Last update February 2026 -
Natural Gas Laws and Incentives by State
Displays states and their respective law and incentive counts related to the use of natural gas
-
Propane Laws and Incentives by State
Displays states and their respective law and incentive counts related to the use of propane
-
Renewable Diesel Laws and Incentives by State
Displays states and their respective law and incentive counts related to the use of renewable diesel


-
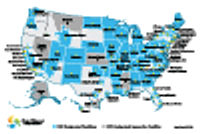
Clean Cities and Communities Coalition Locations
Displays coalition locations and boundaries across the United States
Last update March 2026 -
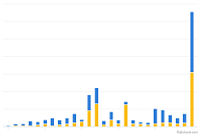
Clean Cities and Communities Project Awards and Matching Funds
Trend of competitive project awards and matching funds from 1998 to 2023
Last update January 2026
-
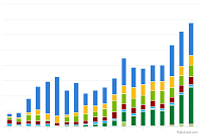
Clean Cities and Communities Alternative Fuel Vehicle Inventory
Alternative fuel vehicle inventory reported by Clean Cities and Communities coalitions from 2004 to 2023
Last update January 2026 -
Clean Cities and Communities Energy Use Impact by AFV Type
Trend of energy impact by fuels used in alternative fuel vehicles (AFVs) from 2004 to 2023
Last update January 2026
-
Clean Cities and Communities Annual Energy Use Impact
Trend of reduced fuel use and increased fuel diversity from 1994 to 2023
Last update January 2026 -
Clean Cities and Communities Cumulative Energy Use Impact
Cumulative trend of reduced fuel use and increased fuel diversity from 1994 to 2023
Last update January 2026 -
Clean Cities and Communities Energy Use Impact by AFV Type
Trend of energy impact by fuels used in alternative fuel vehicles (AFVs) from 2004 to 2023
Last update January 2026 -
Clean Cities and Communities Energy Use Impact by VMT Reduction and FE
Trend of energy impact by fuel economy (FE) improvements and reductions in vehicle miles traveled (VMT) from 2004 to 2023
Last update January 2026