Maps and Data - Hydrogen Fueling Station Locations by State
Find maps and charts showing transportation data and trends related to alternative fuels and vehicles.
-
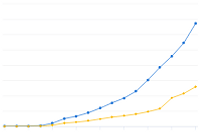
U.S. Private Electric Vehicle Charging Infrastructure
Trend of private electric vehicle charging infrastructure in the United States from 2007 to 2023
Last update March 2024 -
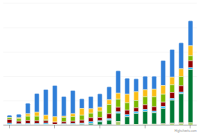
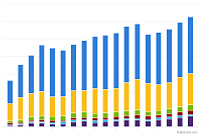
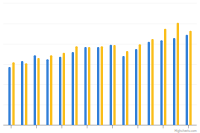
U.S. Public and Private Alternative Fueling Stations by Fuel Type
Trend of alternative fueling station counts by fuel type in the United States from 1992 to 2025
Last update January 2026 -
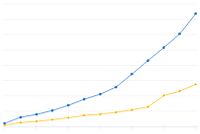
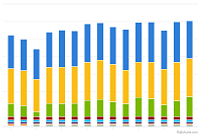
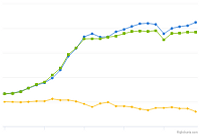
U.S. Public and Private Electric Vehicle Charging Infrastructure
Trend of public and private electric vehicle charging infrastructure in the United States from 2011 to 2023
Last update March 2024 -
U.S. Public Electric Vehicle Charging Infrastructure
Trend of public electric vehicle charging infrastructure in the United States from 2007 to 2023
Last update March 2024
-
Clean Cities and Communities Energy Use Impact through Idle Reduction
Trend of energy impact by idle reduction policies and technologies from 2004 to 2024
Last update June 2026
-
Miles of U.S. Transportation Infrastructure in 2023
Distance covered by different types of transportation infrastructure in 2023
Last update January 2026
-
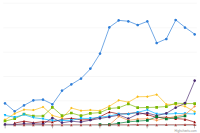
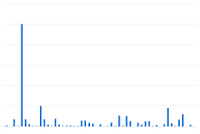
Global Ethanol Production by Country or Region
Quantity of ethanol produced by country/region from 2007 to 2024
Last update January 2026 -
Renewable Fuel RFS2 Mandates and Net RINs Generated
Displays yearly Renewable Fuel Standard (RFS) mandates from Environmental Protection Agency (EPA) volume requirements, and net Renewable Identification Numbers (RINs) generated
Last update May 2026 -
RFS2 Mandates and Net RINs Generated for Cellulosic Biofuels
Displays yearly Renewable Fuel Standard (RFS) mandates from Environmental Protection Agency (EPA) volume requirements, and net Renewable Identification Numbers (RINs) generated
Last update February 2026 -
Total Advanced Biofuel RFS2 Mandates and Net RINs Generated
Displays yearly Renewable Fuel Standard (RFS) mandates from Environmental Protection Agency (EPA) volume requirements, and net Renewable Identification Numbers (RINs) generated
Last update May 2026 -
Total RFS2 Mandates and Net RINs Generated
Displays yearly Renewable Fuel Standard (RFS) mandates from Environmental Protection Agency (EPA) volume requirements, and net Renewable Identification Numbers (RINs) generated
Last update May 2026 -
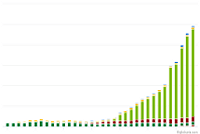
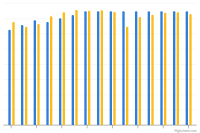
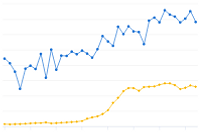
U.S. Biodiesel Production, Exports, and Consumption
Trend of biodiesel production, exports, and consumption from 2001 to 2025
Last update May 2026 -
U.S. Corn Production and Portion Used for Fuel Ethanol
Trend of corn produced in the United States and quantity used for ethanol from 1986 to 2023
Last update January 2024 -
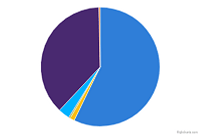
U.S. Corn Use by Market Year
Annual usage of the U.S. corn crop according to end product or destination
Last update January 2026 -
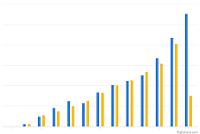
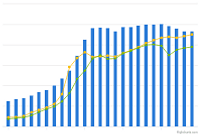
U.S. Ethanol Plants, Capacity, and Production
Trend of ethanol plant counts and production volumes from 1999 to 2023
Last update April 2024 -
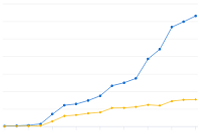
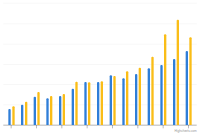
U.S. Production, Consumption, and Trade of Ethanol
Trend of total ethanol fuel production and consumption from 2000 to 2024
Last update January 2026 -
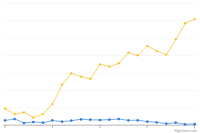
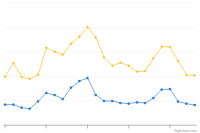
U.S. Soybean and Corn Prices
Trend of soybean and corn prices, adjusted for inflation, from 2002 to 2025
Last update June 2026

-
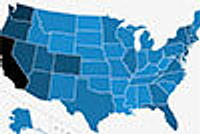
Electric Vehicle Registrations by State
U.S. light-duty electric vehicle population as of December 2023
Last update September 2024 -
TransAtlas
Interactive map displays light-duty vehicle registration counts over time by state and fuel type
-
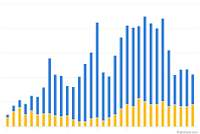
AFV Acquisitions by Regulated Fleets (by Fleet Type)
Trend of State & Alternative Fuel Provider (S&FP) alternative fuel vehicle (AFV) acquisitions by fleet type from 1992 to 2024
Last update February 2026 -
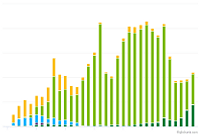
AFV Acquisitions by Regulated Fleets (by Fuel Type)
Trend of State & Alternative Fuel Provider (S&FP) alternative fuel vehicle (AFV) acquisitions by fuel type from 1992 to 2024
Last update February 2026 -
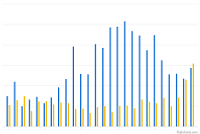
Annual Vehicle Credits Earned and Used by Regulated Fleets
Trend of State & Alternative Fuel Provider (S&FP) EPAct credits traded and transactions from 1999 to 2024
Last update February 2026 -
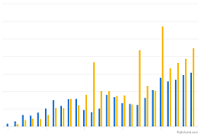
Biodiesel Purchases by EPAct-Regulated Fleets
Trend of State and Alternative Fuel Provider Biodiesel Purchases from 2000 to 2024
Last update February 2026 -
Clean Cities and Communities Alternative Fuel Vehicle Inventory
Alternative fuel vehicle inventory reported by Clean Cities and Communities coalitions from 2004 to 2024
Last update June 2026 -
Clean Cities and Communities Energy Use Impact by AFV Type
Trend of energy impact by fuels used in alternative fuel vehicles (AFVs) from 2004 to 2024
Last update June 2026